Clayton: Fire Incidents, Illinois (IL)
Where are fire incidents reported in Clayton, IL
Something went wrong! Please refresh the page.
|
| |||||||||||||||||||||||||||||||||||||||||||||||||||||||||||||||||||||||||||||||||||||||||||||||||||||||||||||
2002 - 2018 National Fire Incident Reporting System (NFIRS) incidents
- Incident types reported to NFIRS in Clayton, IL
- 22072.1%Fire
- 278.9%Hazardous Condition
- 268.5%Good Intent Call
- 237.5%Rescue & EMS
- 51.6%False Alarm
- 41.3%Service Call
- Fire incident types reported to NFIRS in Clayton, IL
- 10447.3%Structure Fires
- 9643.6%Outside Fires
- 135.9%Other
- 73.2%Mobile Property/Vehicle Fires
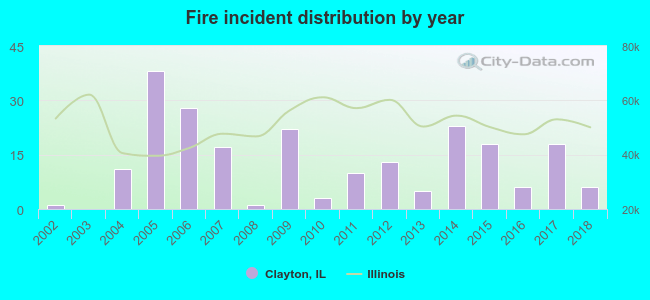 Based on the data from the years 2002 - 2018 the average number of fire incidents per year is 13. The highest number of fire incidents - 38 took place in 2005, and the least - 0 in 2003. The data has an increasing trend.
 25.9% incidents where reported in the morning and 74.1% in the evening. The most fires (17.7%) took place on Friday, and the least (10.5%) on Thursday.
 Based on the 220 fire incidents from years 2002 - 2018 most fires (23.2%) took place during March, and the least (4.1%) in June.
 Out of all 305 cases reported during the years 2002 - 2018, the most belonged to the categories: Fire (72.1%), Rescue & EMS (8.9%), and Service Call (8.5%).
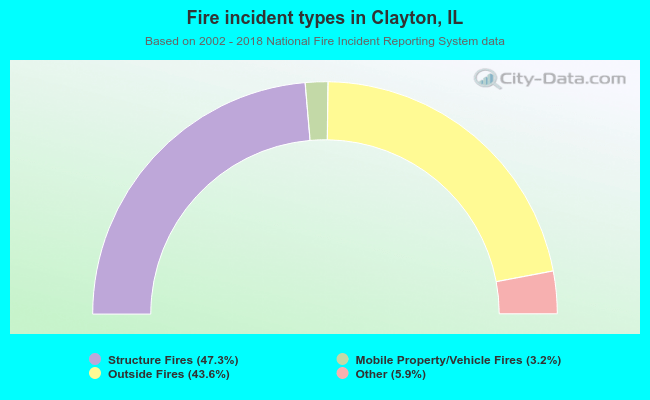 When looking into fire subcategories, the most incidents belonged to: Structure Fires (47.3%), and Outside Fires (43.6%).