Clarence: Fire Incidents, New York (NY)
Where are fire incidents reported in Clarence, NY
Something went wrong! Please refresh the page.
|
| |||||||||||||||||||||||||||||||||||||||||||||||||||||||||||||||||||||||||||||||||||||||||||||||||||||||||||||
2002 - 2018 National Fire Incident Reporting System (NFIRS) incidents
- Incident types reported to NFIRS in Clarence, NY
- 1,40256.2%Rescue & EMS
- 33613.5%Fire
- 28911.6%Hazardous Condition
- 28211.3%False Alarm
- 1144.6%Service Call
- 622.5%Good Intent Call
- 50.2%Special Incident
- Fire incident types reported to NFIRS in Clarence, NY
- 19156.8%Structure Fires
- 8425.0%Outside Fires
- 3610.7%Other
- 257.4%Mobile Property/Vehicle Fires
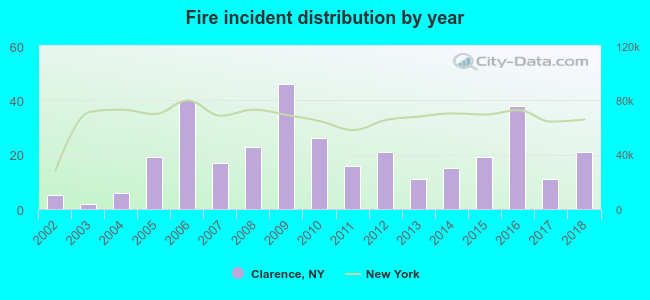 Based on the data from the years 2002 - 2018 the average number of fires per year is 20. The highest number of reported fires - 46 took place in 2009, and the least - 2 in 2003. The data has a rising trend.
The average number of yearly fire incidents per 10k residents in Clarence, NY compared to nearest cities:
(Note: Based on data for the last 3 years, including only cities with population 5,000 and above)
| Clarence: | 7.6 |
| Williamsville: | 100.3 |
| Amherst: | 14.9 |
| Newstead: | 4.3 |
| Depew: | 28.7 |
| Lancaster: | 35.0 |
| Eggertsville: | 1.0 |
| Cheektowaga: | 32.4 |
| Pendleton: | 1.6 |

 32.4% incidents where reported in the morning and 67.6% in the evening. The most fires (17.3%) took place on Saturday, and the least (10.1%) on Thursday.
 According to the 336 fire incident reports from years 2002 - 2018 most fires (11.0%) took place during October, and the least (5.1%) in November.
 Out of all 2,493 cases reported during the years 2002 - 2018, the most belonged to the categories: Rescue & EMS (56.2%), Fire (13.5%), and Hazardous Condition (11.6%).
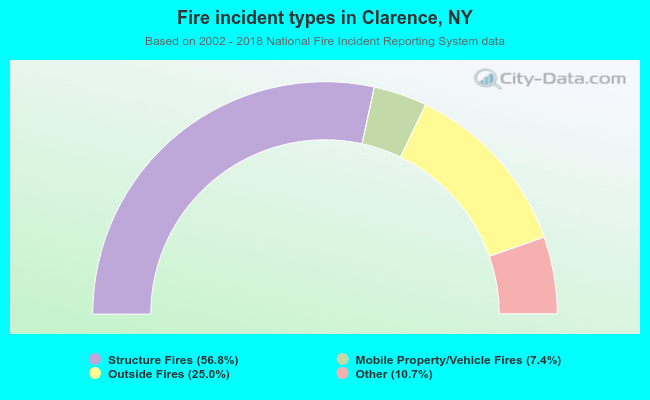 When looking into fire subcategories, the most incidents belonged to: Structure Fires (56.8%), and Outside Fires (25.0%).