| Fire incidents reported |
|---|
| Sreet name | Count |
|---|
| GOODRICH RD | 30 | | CLARENCE CENTER RD | 18 | | GOODRICH RD | 16 | | GOODRICH ROAD | 14 | | SALT RD | 12 | | COUNTY ROAD | 10 | | BRAUER RD | 8 | | CLARENCE CENTER RD | 8 | | KELLER ROAD | 8 | | LAPP RD | 8 | | SALT ROAD | 8 | | CLARENCE CENTER | 6 | | CLARENCE CENTER ROAD | 6 | | COUNTY RD | 6 | | COUNTY RD | 6 | | HERR RD | 6 | | KELLER RD | 6 | | ROLL RD | 6 | | STRICKLER RD | 6 | | TONAWANDA CREEK RD | 6 | | TONAWANDA CREEK ROAD | 6 | | BLACK WALNUT DR | 4 | | GOODRICH | 4 | | GOODRICHSESH RDS | 4 | | HEISE RD | 4 |
| | | Fire incidents reported |
|---|
| Sreet name | Count |
|---|
| KRAUS RD | 4 | | LAPP RD | 4 | | LONG ST | 4 | | LONG STREET | 4 | | NORTHFIELD ROAD | 4 | | ROLL ROAD | 4 | | SALT RD. | 4 | | SESH RD | 4 | | STONEBRIAR DRIVE | 4 | | STRICKLER RD | 4 | | THOMPSON RD | 4 | | TONAWANDA CREEK RD | 4 | | 8455 CLARENCE CENTER RD. | 2 | | BEACH MEADOWS | 2 | | BRAUER RD | 2 | | BRIDLEWOOD DR SOUTH | 2 | | CANDLEWOOD | 2 | | CARMELO CT | 2 | | CEDAR RD | 2 | | CEDAR RD | 2 | | CEDAR ST | 2 | | CHATHAM DR | 2 | | CHATHAM LN | 2 | | CHATHAM LN | 2 | | CLARENC E CENTER RD | 2 |
|
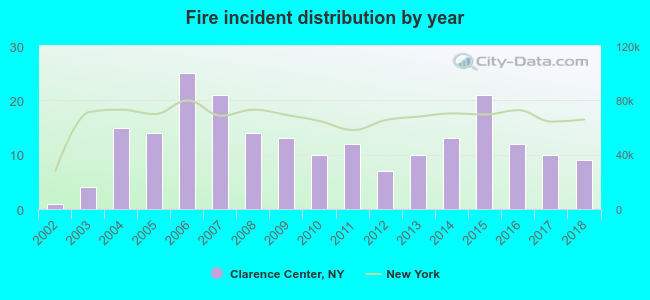 Based on the data from the years 2002 - 2018 the average number of fire incidents per year is 12. The highest number of reported fire incidents - 25 took place in 2006, and the least - 1 in 2002. The data has a growing trend.
 25.6% incidents where reported in the morning and 74.4% in the evening. The most fires (20.4%) took place on Thursday, and the least (10.9%) on Sunday.
 According to the 211 reports from years 2002 - 2018 most fires (11.8%) took place during May, and the least (3.8%) in November.
 Out of all 1,704 cases reported during the years 2002 - 2018, the most belonged to the categories: Rescue & EMS (58.9%), False Alarm (14.6%), and Fire (12.4%).
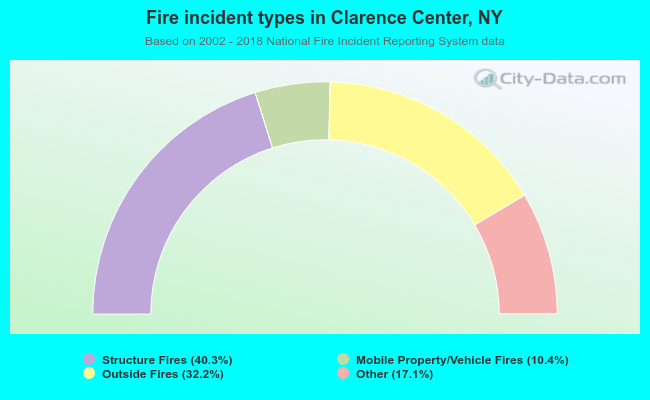 When looking into fire subcategories, the most incidents belonged to: Structure Fires (40.3%), and Outside Fires (32.2%).