Cisco: Fire Incidents, Illinois (IL)
Where are fire incidents reported in Cisco, IL
Something went wrong! Please refresh the page.
|
| |||||||||||||||||||||||||||||||||||||||||||||||||||||||||||||||||||||||||||||||||||||||||||||||||||||||||||||
2006 - 2018 National Fire Incident Reporting System (NFIRS) incidents
- Incident types reported to NFIRS in Cisco, IL
- 21854.6%Rescue & EMS
- 12230.6%Fire
- 143.5%Good Intent Call
- 133.3%Severe Weather
- 123.0%Hazardous Condition
- 102.5%False Alarm
- 92.3%Service Call
- 10.3%Overpressure Rupture
- Fire incident types reported to NFIRS in Cisco, IL
- 5645.9%Outside Fires
- 3327.0%Structure Fires
- 1915.6%Mobile Property/Vehicle Fires
- 1411.5%Other
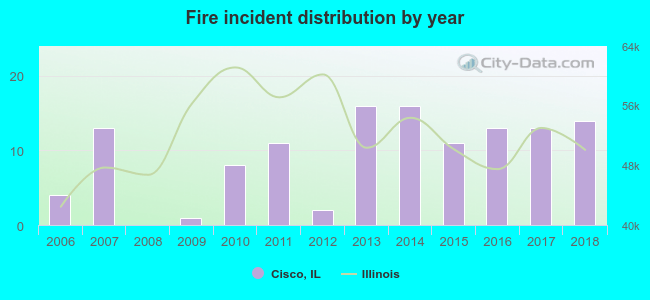 According to the data from the years 2006 - 2018 the average number of fire incidents per year is 9. The highest number of reported fires - 16 took place in 2013, and the least - 0 in 2008. The data has a growing trend.
 21.3% incidents where reported in the morning and 78.7% in the evening. The most fires (21.3%) took place on Wednesday, and the least (8.2%) on Sunday.
 Based on the 122 fires from years 2006 - 2018 most fires (19.7%) took place during March, and the least (3.3%) in January.
 Out of all 399 cases reported during the years 2006 - 2018, the most belonged to the categories: Rescue & EMS (54.6%), Fire (30.6%), and Good Intent Call (3.5%).
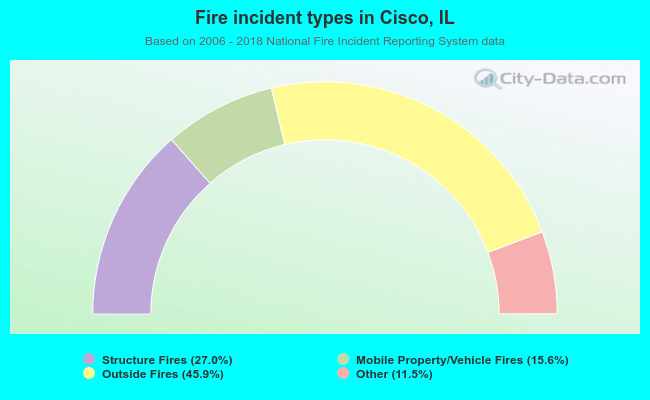 When looking into fire subcategories, the most incidents belonged to: Outside Fires (45.9%), and Structure Fires (27.0%).