Church Point: Fire Incidents, Louisiana (LA)
Where are fire incidents reported in Church Point, LA
Something went wrong! Please refresh the page.
|
| |||||||||||||||||||||||||||||||||||||||||||||||||||||||||||||||||||||||||||||||||||||||||||||||||||||||||||||
| Other | 48 | |||||||||||||||||||||||||||||||||||||||||||||||||||||||||||||||||||||||||||||||||||||||||||||||||||||||||||||
2002 - 2018 National Fire Incident Reporting System (NFIRS) incidents
- Incident types reported to NFIRS in Church Point, LA
- 59633.9%Fire
- 58433.3%Rescue & EMS
- 32018.2%Hazardous Condition
- 945.4%Service Call
- 814.6%False Alarm
- 744.2%Good Intent Call
- 30.2%Severe Weather
- 20.1%Overpressure Rupture
- 20.1%Special Incident
- Fire incident types reported to NFIRS in Church Point, LA
- 27946.8%Outside Fires
- 21636.2%Structure Fires
- 8614.4%Mobile Property/Vehicle Fires
- 152.5%Other
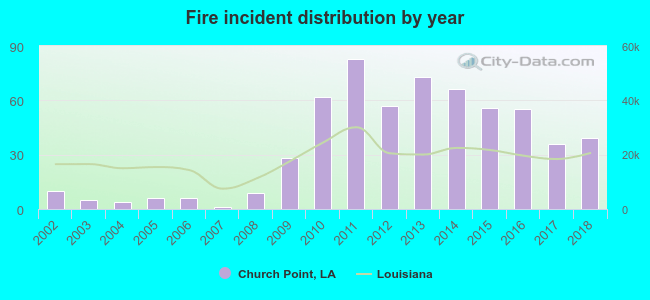 According to the data from the years 2002 - 2018 the average number of fires per year is 35. The highest number of reported fire incidents - 83 took place in 2011, and the least - 1 in 2007. The data has a growing trend.
 The median response time based on all reported fire incidents is 7 minutes. This is comparable to the Louisiana median value.
The median response time in Church Point, LA compared to nearest cities:
(Note: Based on data for all years, including only cities with at least 500 fire incidents)
| Church Point: | 7 minutes |
| Opelousas: | 5 minutes |
| Duson: | 8 minutes |
| Rayne: | 6 minutes |
| Carencro: | 8 minutes |
| Eunice: | 4 minutes |
| Scott: | 9 minutes |
| Crowley: | 3 minutes |
| Arnaudville: | 11 minutes |
 Based on the data from the years 2002 - 2018 the average number of fire-related yearly deaths is 0. The highest number of reported deaths - 1 took place in 2002, and the lowest - 0 in 2003. The data has a dropping trend.
 27.7% incidents where reported in the morning and 72.3% in the evening. The most fires (20.1%) took place on Saturday, and the least (10.7%) on Tuesday.
 According to the 596 fire incident reports from years 2002 - 2018 most fires (12.1%) took place during January, and the least (5.5%) in August.
 Out of all 1,756 cases reported during the years 2002 - 2018, the most belonged to the categories: Fire (33.9%), Rescue & EMS (33.3%), and Hazardous Condition (18.2%).
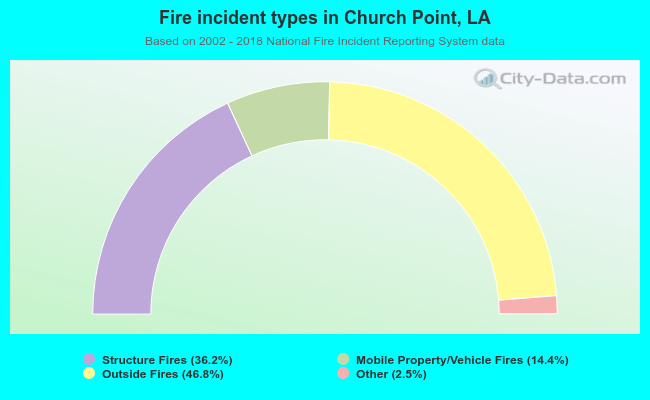 When looking into fire subcategories, the most reports belonged to: Outside Fires (46.8%), and Structure Fires (36.2%).