Chilton: Fire Incidents, Wisconsin (WI)
Where are fire incidents reported in Chilton, WI
Something went wrong! Please refresh the page.
|
| |||||||||||||||||||||||||||||||||||||||||||||||||||||||||||||||||||||||||||||||||||||||||||||||||||||||||||||
| Other | 10 | |||||||||||||||||||||||||||||||||||||||||||||||||||||||||||||||||||||||||||||||||||||||||||||||||||||||||||||
2002 - 2018 National Fire Incident Reporting System (NFIRS) incidents
- Incident types reported to NFIRS in Chilton, WI
- 47452.4%Fire
- 15617.2%Hazardous Condition
- 12613.9%False Alarm
- 758.3%Good Intent Call
- 495.4%Rescue & EMS
- 182.0%Service Call
- 50.6%Severe Weather
- 10.1%Overpressure Rupture
- 10.1%Special Incident
- Fire incident types reported to NFIRS in Chilton, WI
- 30865.0%Structure Fires
- 9019.0%Outside Fires
- 4810.1%Mobile Property/Vehicle Fires
- 285.9%Other
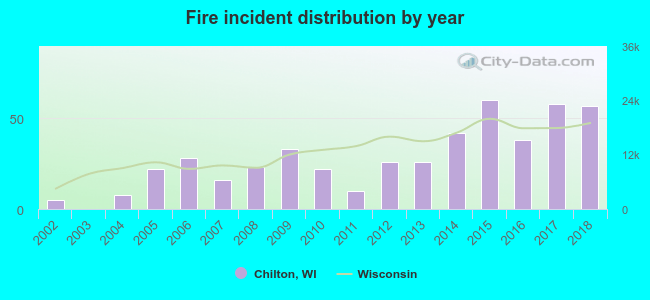 Based on the data from the years 2002 - 2018 the average number of fires per year is 28. The highest number of fires - 60 took place in 2015, and the least - 0 in 2003. The data has a growing trend.
 41.1% incidents where reported in the morning and 58.9% in the evening. The most fires (18.8%) took place on Monday, and the least (10.1%) on Wednesday.
 According to the 474 fire incidents from years 2002 - 2018 most fires (13.1%) took place during April, and the least (4.0%) in September.
 Out of all 905 cases reported during the years 2002 - 2018, the most belonged to the categories: Fire (52.4%), Hazardous Condition (17.2%), and False Alarm (13.9%).
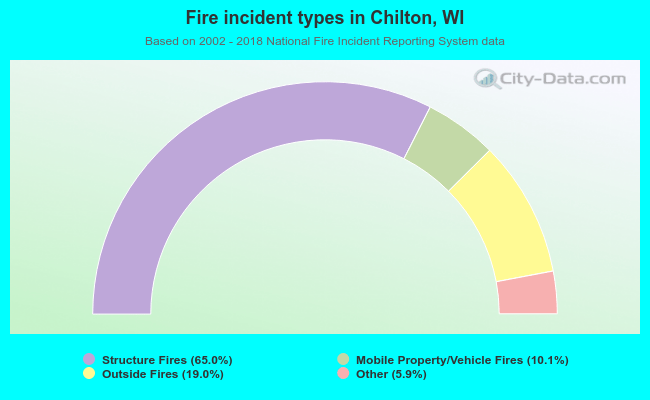 When looking into fire subcategories, the most reports belonged to: Structure Fires (65.0%), and Outside Fires (19.0%).