Chiefland: Fire Incidents, Florida (FL)
Where are fire incidents reported in Chiefland, FL
Something went wrong! Please refresh the page.
|
| |||||||||||||||||||||||||||||||||||||||||||||||||||||||||||||||||||||||||||||||||||||||||||||||||||||||||||||
| Other | 281 | |||||||||||||||||||||||||||||||||||||||||||||||||||||||||||||||||||||||||||||||||||||||||||||||||||||||||||||
2002 - 2018 National Fire Incident Reporting System (NFIRS) incidents
- Incident types reported to NFIRS in Chiefland, FL
- 9,11776.9%Rescue & EMS
- 1,19510.1%Fire
- 6545.5%Good Intent Call
- 4653.9%Hazardous Condition
- 2462.1%Service Call
- 1141.0%False Alarm
- 310.3%Special Incident
- 240.2%Severe Weather
- Fire incident types reported to NFIRS in Chiefland, FL
- 55946.8%Outside Fires
- 34729.0%Structure Fires
- 20617.2%Mobile Property/Vehicle Fires
- 836.9%Other
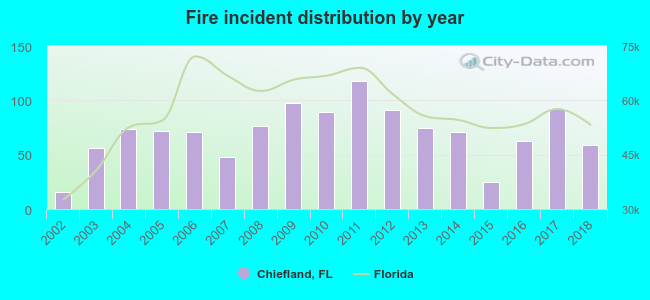 According to the data from the years 2002 - 2018 the average number of fire incidents per year is 70. The highest number of fire incidents - 118 took place in 2011, and the least - 16 in 2002. The data has an increasing trend.
 The median response time based on all reported fire incidents is 9 minutes. This is higher than the Florida median value.
The median response time in Chiefland, FL compared to nearest cities:
(Note: Based on data for all years, including only cities with at least 500 fire incidents)
| Chiefland: | 9 minutes |
| Fanning Springs: | 12 minutes |
| Trenton: | 13 minutes |
| Bronson: | 13 minutes |
| Newberry: | 9 minutes |
| Cross City: | 6 minutes |
| Williston: | 9 minutes |
| High Springs: | 9 minutes |
| Morriston: | 14 minutes |
 Based on the data from the years 2002 - 2018 the average number of fire-related fatalities per year is 0. The highest number of deaths - 1 took place in 2004, and the lowest - 0 in 2002. The data has a constant trend.
 27.1% incidents where reported in the morning and 72.9% in the evening. The most fires (17.9%) took place on Thursday, and the least (11.8%) on Sunday.
 Based on the 1,195 fires from years 2002 - 2018 most fires (13.4%) took place during February, and the least (3.8%) in August.
 Out of all 11,849 cases reported during the years 2002 - 2018, the most belonged to the categories: Rescue & EMS (76.9%), Fire (10.1%), and Good Intent Call (5.5%).
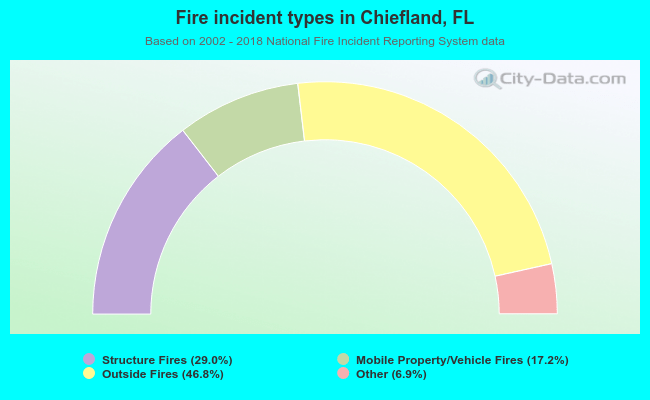 When looking into fire subcategories, the most reports belonged to: Outside Fires (46.8%), and Structure Fires (29.0%).