Chevy Chase: Fire Incidents, Maryland (MD)
Where are fire incidents reported in Chevy Chase, MD
Something went wrong! Please refresh the page.
|
| |||||||||||||||||||||||||||||||||||||||||||||||||||||||||||||||||||||||||||||||||||||||||||||||||||||||||||||
| Other | 96 | |||||||||||||||||||||||||||||||||||||||||||||||||||||||||||||||||||||||||||||||||||||||||||||||||||||||||||||
2005 - 2018 National Fire Incident Reporting System (NFIRS) incidents
- Incident types reported to NFIRS in Chevy Chase, MD
- 7,77358.8%Rescue & EMS
- 1,58312.0%Hazardous Condition
- 1,49811.3%Good Intent Call
- 9587.2%False Alarm
- 9457.1%Service Call
- 3963.0%Fire
- 540.4%Special Incident
- Fire incident types reported to NFIRS in Chevy Chase, MD
- 15839.9%Structure Fires
- 13433.8%Outside Fires
- 6416.2%Mobile Property/Vehicle Fires
- 4010.1%Other
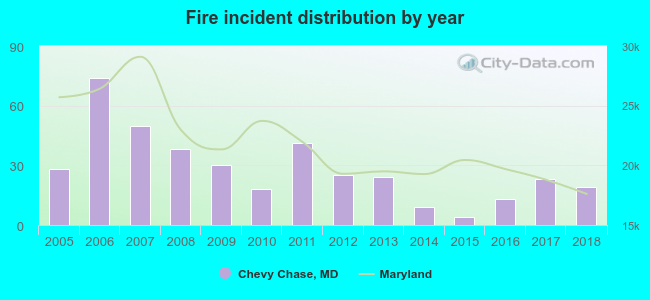 Based on the data from the years 2005 - 2018 the average number of fires per year is 28. The highest number of reported fire incidents - 74 took place in 2006, and the least - 4 in 2015. The data has a dropping trend.
 According to the reports from the years 2005 - 2018 the average number of fire-related yearly casualties is 1. The highest number of reported casualties - 3 took place in 2018, and the lowest - 0 in 2005. The data has a growing trend.
 28.8% incidents where reported in the morning and 71.2% in the evening. The most fires (16.9%) took place on Saturday, and the least (12.6%) on Thursday.
 Based on the 396 fires from years 2005 - 2018 most fires (11.9%) took place during May, and the least (5.8%) in February.
 Out of all 13,221 cases reported during the years 2005 - 2018, the most belonged to the categories: Rescue & EMS (58.8%), Hazardous Condition (12.0%), and Good Intent Call (11.3%).
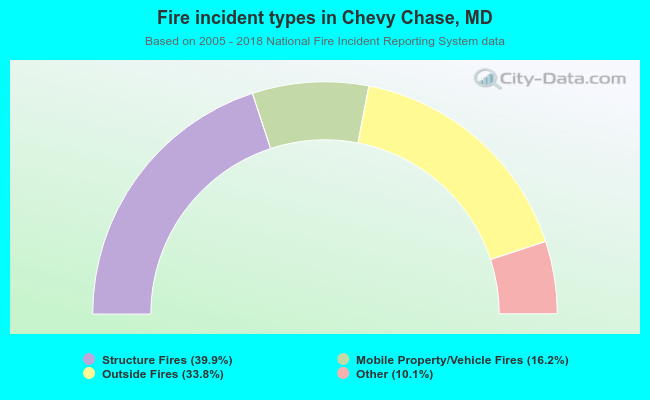 When looking into fire subcategories, the most reports belonged to: Structure Fires (39.9%), and Outside Fires (33.8%).