Chesterfield: Fire Incidents, Indiana (IN)
Where are fire incidents reported in Chesterfield, IN
Something went wrong! Please refresh the page.
|
| |||||||||||||||||||||||||||||||||||||||||||||||||||||||||||||||||||||||||||||||||||||||||||||||||||||||||||||
| Other | 41 | |||||||||||||||||||||||||||||||||||||||||||||||||||||||||||||||||||||||||||||||||||||||||||||||||||||||||||||
2002 - 2018 National Fire Incident Reporting System (NFIRS) incidents
- Incident types reported to NFIRS in Chesterfield, IN
- 1,52957.1%Rescue & EMS
- 53920.1%Fire
- 2288.5%Hazardous Condition
- 2228.3%Service Call
- 1023.8%Good Intent Call
- 481.8%False Alarm
- 90.3%Special Incident
- Fire incident types reported to NFIRS in Chesterfield, IN
- 25847.9%Structure Fires
- 16931.4%Outside Fires
- 6612.2%Mobile Property/Vehicle Fires
- 468.5%Other
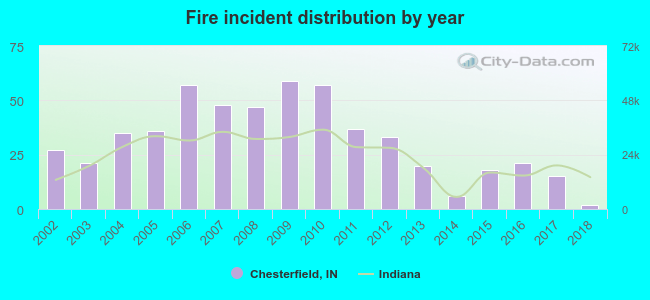 According to the data from the years 2002 - 2018 the average number of fire incidents per year is 32. The highest number of reported fires - 59 took place in 2009, and the least - 2 in 2018. The data has a dropping trend.
 The median response time based on all reported fire incidents is 8 minutes. This is higher compared to the state median value.
The median response time in Chesterfield, IN compared to nearest cities:
(Note: Based on data for all years, including only cities with at least 500 fire incidents)
| Chesterfield: | 8 minutes |
| Daleville: | 8 minutes |
| Anderson: | 7 minutes |
| Middletown: | 6 minutes |
| Yorktown: | 9 minutes |
| Pendleton: | 8 minutes |
| Alexandria: | 5 minutes |
| Muncie: | 5 minutes |
| Gaston: | 8 minutes |
 32.3% incidents where reported in the morning and 67.7% in the evening. The most fires (15.4%) took place on Tuesday, and the least (12.4%) on Sunday.
 Based on the 539 incident reports from years 2002 - 2018 most fires (12.1%) took place during October, and the least (5.8%) in July.
 Out of all 2,680 cases reported during the years 2002 - 2018, the most belonged to the categories: Rescue & EMS (57.1%), Fire (20.1%), and Hazardous Condition (8.5%).
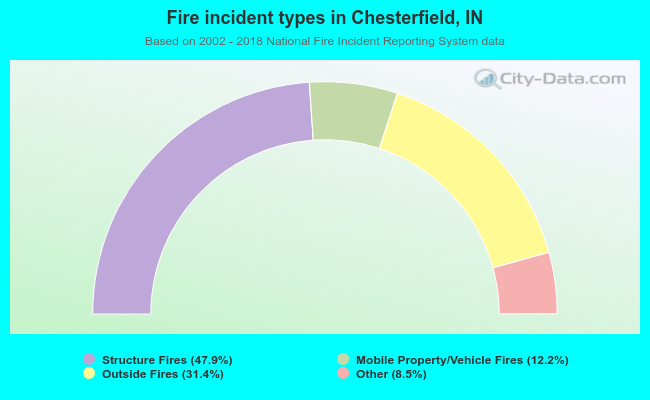 When looking into fire subcategories, the most incidents belonged to: Structure Fires (47.9%), and Outside Fires (31.4%).