Cherryville: Fire Incidents, North Carolina (NC)
Where are fire incidents reported in Cherryville, NC
Something went wrong! Please refresh the page.
|
| |||||||||||||||||||||||||||||||||||||||||||||||||||||||||||||||||||||||||||||||||||||||||||||||||||||||||||||
2002 - 2018 National Fire Incident Reporting System (NFIRS) incidents
- Incident types reported to NFIRS in Cherryville, NC
- 3,10438.6%Rescue & EMS
- 2,24827.9%Service Call
- 94311.7%Fire
- 7569.4%Hazardous Condition
- 6718.3%Good Intent Call
- 2943.7%False Alarm
- 200.2%Severe Weather
- 90.1%Special Incident
- Fire incident types reported to NFIRS in Cherryville, NC
- 45247.9%Structure Fires
- 35137.2%Outside Fires
- 10210.8%Mobile Property/Vehicle Fires
- 384.0%Other
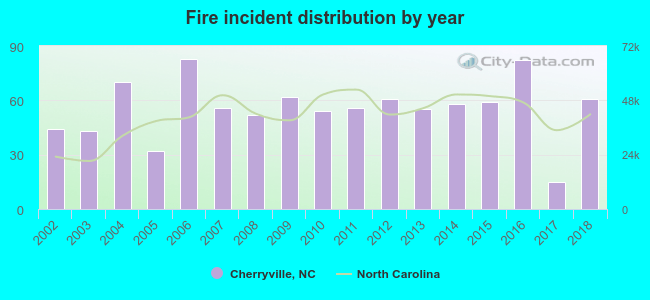 According to the data from the years 2002 - 2018 the average number of fires per year is 55. The highest number of fire incidents - 83 took place in 2006, and the least - 15 in 2017. The data has a growing trend.
The average number of yearly fire incidents per 10k residents in Cherryville, NC compared to nearest cities:
(Note: Based on data for the last 3 years, including only cities with population 5,000 and above)
| Cherryville: | 89.2 |
| Bessemer City: | 46.8 |
| Kings Mountain: | 112.4 |
| Lincolnton: | 216.8 |
| Shelby: | 78.1 |
| Gastonia: | 18.4 |
| Mount Holly: | 58.7 |
| Newton: | 24.1 |
| Belmont: | 50.1 |
 The median response time based on all reported fire incidents is 7 minutes. This is similar to the North Carolina median value.
The median response time in Cherryville, NC compared to nearest cities:
(Note: Based on data for all years, including only cities with at least 500 fire incidents)
| Cherryville: | 7 minutes |
| Kings Mountain: | 7 minutes |
| Lincolnton: | 6 minutes |
| Lawndale: | 8 minutes |
| Shelby: | 8 minutes |
| Dallas: | 8 minutes |
| Laurel Hill: | 7 minutes |
| Gastonia: | 6 minutes |
| Grover: | 7 minutes |
 26.6% incidents where reported in the morning and 73.4% in the evening. The most fires (15.4%) took place on Tuesday, and the least (13.0%) on Thursday.
 Based on the 943 fire incidents from years 2002 - 2018 most fires (12.3%) took place during April, and the least (4.9%) in October.
 Out of all 8,050 cases reported during the years 2002 - 2018, the most belonged to the categories: Rescue & EMS (38.6%), Service Call (27.9%), and Fire (11.7%).
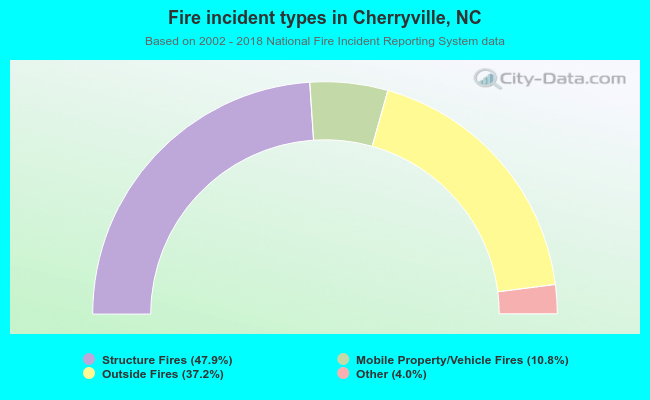 When looking into fire subcategories, the most reports belonged to: Structure Fires (47.9%), and Outside Fires (37.2%).