Cheboygan: Fire Incidents, Michigan (MI)
Where are fire incidents reported in Cheboygan, MI
Something went wrong! Please refresh the page.
|
| |||||||||||||||||||||||||||||||||||||||||||||||||||||||||||||||||||||||||||||||||||||||||||||||||||||||||||||
| Other | 41 | |||||||||||||||||||||||||||||||||||||||||||||||||||||||||||||||||||||||||||||||||||||||||||||||||||||||||||||
2002 - 2018 National Fire Incident Reporting System (NFIRS) incidents
- Incident types reported to NFIRS in Cheboygan, MI
- 25768.0%Fire
- 7419.6%Hazardous Condition
- 184.8%Rescue & EMS
- 133.4%False Alarm
- 82.1%Good Intent Call
- 41.1%Service Call
- 20.5%Overpressure Rupture
- 20.5%Special Incident
- Fire incident types reported to NFIRS in Cheboygan, MI
- 15961.9%Structure Fires
- 4316.7%Outside Fires
- 4116.0%Mobile Property/Vehicle Fires
- 145.4%Other
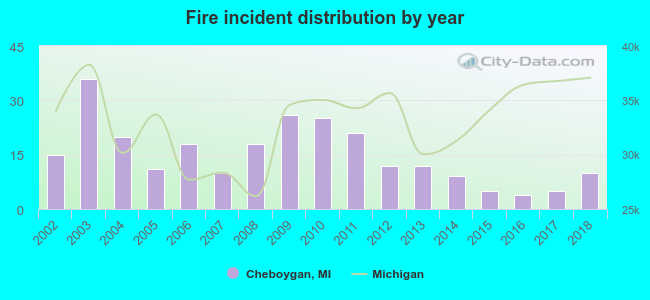 Based on the data from the years 2002 - 2018 the average number of fire incidents per year is 15. The highest number of fires - 36 took place in 2003, and the least - 4 in 2016. The data has a dropping trend.
 Based on the data from the years 2002 - 2018 the average number of fire-related casualties per year is 0. The highest number of reported injuries - 1 took place in 2006, and the lowest - 0 in 2002. The data has an increasing trend.
 37.7% incidents where reported in the morning and 62.3% in the evening. The most fires (17.5%) took place on Thursday, and the least (10.1%) on Wednesday.
 According to the 257 reports from years 2002 - 2018 most fires (12.8%) took place during January, and the least (4.7%) in October.
 Out of all 378 cases reported during the years 2002 - 2018, the most belonged to the categories: Fire (68.0%), Hazardous Condition (19.6%), and Rescue & EMS (4.8%).
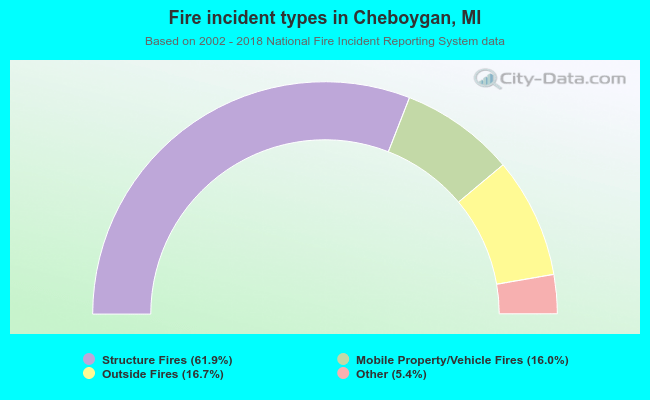 When looking into fire subcategories, the most incidents belonged to: Structure Fires (61.9%), and Outside Fires (16.7%).