| Fire incidents reported |
|---|
| Sreet name | Count |
|---|
| I-10 FWY | 40 | | I10 FWY | 38 | | FLAT CREEK RD | 36 | | MAIN ST | 34 | | LINCOLN DR | 16 | | ATWATER RD | 14 | | I-10 | 14 | | INTERSTATE 10 HWY | 14 | | LITTLE SYCAMORE RD | 12 | | HARDAWAY HWY | 10 | | I10 | 10 | | WOODROW BUTLER RD | 10 | | DANIELS ST | 8 | | FLATCREEK RD | 8 | | HARDAWAY RD | 8 | | 164 WEST I 10 | 6 | | 424 LINE STREET | 6 | | ASPALAGA RD | 6 | | BLDG 1028/UNIT 14/15 | 6 | | BLUE STAR HWY | 6 | | BONNIE HILL RD | 6 | | I 10 | 6 | | MCMILLIAN RD | 6 | | WATSON LN | 6 | | 1013 POPULAR RD RD | 4 |
| | | Fire incidents reported |
|---|
| Sreet name | Count |
|---|
| 26 WASHINGTON STREET | 4 | | 424 LINE ST ST | 4 | | 720 LINCOLN DRIVE | 4 | | 9 EAST MARION ST | 4 | | ATWATER ROAD | 4 | | BALDWIN RD | 4 | | BLDG 1068/AUTO PAINT SHOP | 4 | | BUILDING 1028/UNIT 14/15 | 4 | | BUILDING 1243/UNIT 31 | 4 | | CALDWELL STREET | 4 | | CONGO RD | 4 | | HARDAWAY HWY | 4 | | HIGHWAY 90 | 4 | | HUEY RENTZ CT | 4 | | I 10 EAST BOUND LANE FWY | 4 | | I10 WEST BOUND | 4 | | LOUIE DEAN RD | 4 | | MAIN | 4 | | MARION ST | 4 | | MOCKINGBIRD LN | 4 | | SOUTHWOOD DR | 4 | | WASHINGTON ST | 4 | | WATER ST | 4 | | ZION ST | 4 | | 1003 VALENCIA STREET | 2 |
|
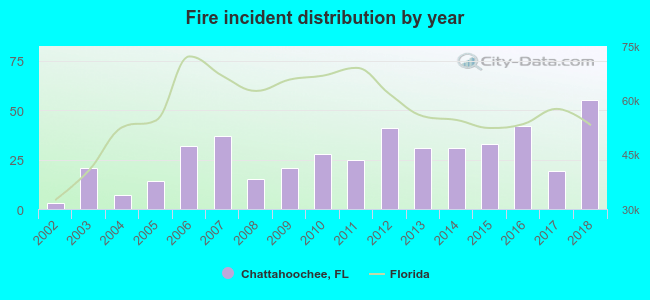 According to the data from the years 2002 - 2018 the average number of fire incidents per year is 27. The highest number of fire incidents - 55 took place in 2018, and the least - 3 in 2002. The data has an increasing trend.
 26.8% incidents where reported in the morning and 73.2% in the evening. The most fires (16.3%) took place on Wednesday, and the least (12.7%) on Saturday.
 According to the 455 incident reports from years 2002 - 2018 most fires (13.4%) took place during March, and the least (5.5%) in July.
 Out of all 8,882 cases reported during the years 2002 - 2018, the most belonged to the categories: Service Call (40.8%), Rescue & EMS (31.3%), and False Alarm (10.1%).
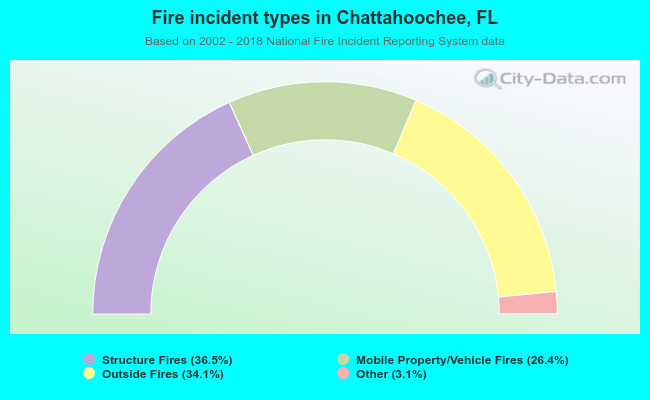 When looking into fire subcategories, the most incidents belonged to: Structure Fires (36.5%), and Outside Fires (34.1%).