| Fire incidents reported |
|---|
| Sreet name | Count |
|---|
| # 30 HWY | 8 | | 6TH RD | 8 | | CORA ST | 8 | | 30 HWY | 6 | | 1052 5TH RD | 4 | | 1084 4TH RD | 4 | | 3RD RD | 4 | | 6TH RD AND I RD | 4 | | 952 6TH RD | 4 | | HWY 30 | 4 | | PRAIRIE | 4 | | 1 EAST OF CHAPMAN #30 | 2 | | 1/4 EAST OF CHAPMAN #30 | 2 | | 10 RD K RD | 2 | | 1001 NORTH PRAIRIE | 2 | | 1005 HYW #30 BAASCH TRAILER #5 | 2 | | 1020 5TH RD | 2 | | 1022 5TH RD | 2 | | 103 HWY #30 | 2 | | 1053 J RD | 2 | | 1081 5TH RD | 2 | | 1097 J RD | 2 | | 10TH H RD | 2 | | 10TH RD & HWY #30 | 2 | | 1132 9TH RD | 2 |
| | | Fire incidents reported |
|---|
| Sreet name | Count |
|---|
| 1221 6TH H RD | 2 | | 1249 5TH RD | 2 | | 1545 ARCHER RD | 2 | | 1855 5TH RD | 2 | | 1TH RD & HWY 30 | 2 | | 2 EAST HWY #30 | 2 | | 2 EAST OF CHAPMAN ON HWY #30 | 2 | | 2 MILES EAST OF CHAPMAN HWY #3 HWY | 2 | | 206 HWY30 LOT 11 | 2 | | 210 10TH STREET | 2 | | 25 MILES NORTH ON ARCHER ROAD | 2 | | 3 & J RD | 2 | | 3 RD RD | 2 | | 321 8TH ST. | 2 | | 346 CHAPMAN ROAD | 2 | | 3RD | 2 | | 404 9TH STREET | 2 | | 407 8TH STREET | 2 | | 412 7TH STREET | 2 | | 477 HRD | 2 | | 4TH RD | 2 | | 4TH RD | 2 | | 4TH RD AND HWY #30 | 2 | | 4TH ROAD | 2 | | |
|
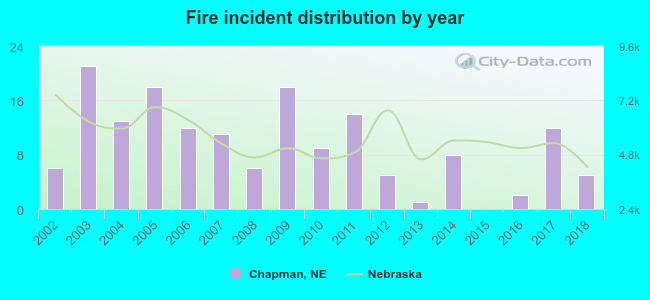 Based on the data from the years 2002 - 2018 the average number of fire incidents per year is 9. The highest number of fire incidents - 21 took place in 2003, and the least - 0 in 2015. The data has a decreasing trend.
 24.8% incidents where reported in the morning and 75.2% in the evening. The most fires (19.9%) took place on Saturday, and the least (10.6%) on Wednesday.
 According to the 161 incident reports from years 2002 - 2018 most fires (21.1%) took place during March, and the least (1.9%) in February.
 Out of all 241 cases reported during the years 2002 - 2018, the most belonged to the categories: Fire (66.8%), Rescue & EMS (22.8%), and Good Intent Call (3.7%).
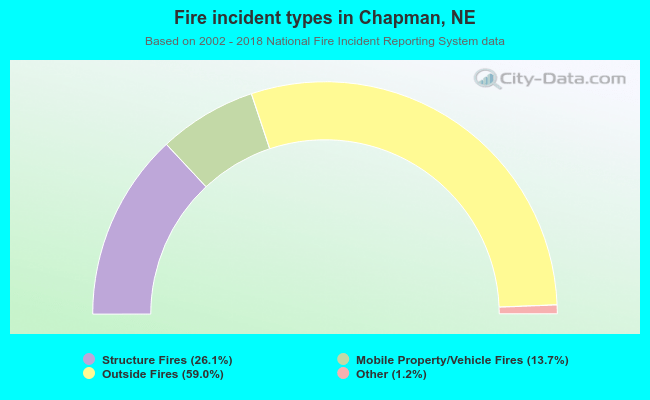 When looking into fire subcategories, the most reports belonged to: Outside Fires (59.0%), and Structure Fires (26.1%).