Chaparral: Fire Incidents, New Mexico (NM)
Where are fire incidents reported in Chaparral, NM
Something went wrong! Please refresh the page.
| Fire incidents reported | |
|---|---|
| Sreet name | Count |
| LISA DR | 54 |
| MESILLA VIEW DR | 48 |
| OASIS DR | 40 |
| HIGHWAY 54 | 38 |
| HERMOSA DR | 34 |
| OASIS | 34 |
| LISA | 32 |
| HERMOSA | 30 |
| PALOMA BLANCA | 30 |
| STATE LINE | 30 |
| MESILLA VIEW | 26 |
| HWY 54 | 24 |
| PALOMA BLANCA DR | 24 |
| LUNA DR | 20 |
| COUNTY LINE DR | 18 |
| EL PASEO | 18 |
| LUNA AZUL RD | 18 |
| DESERT AIRE DR | 16 |
| ESCONDIDO | 16 |
| HIGHWAY 54 HWY | 16 |
| LUNA AZUL | 16 |
| MESILLA VW | 16 |
| TORNILLO FLATS | 16 |
| DIVINE WAY | 14 |
| HEAVENS WAY | 14 |
| AMADOR | 12 |
| ARCH ANGEL | 12 |
| CALLE DE MADERO | 12 |
| COUNTY LINE | 12 |
| GOLDEN SUN DR | 12 |
| Other | 209 |
2009 - 2018 National Fire Incident Reporting System (NFIRS) incidents
- Incident types reported to NFIRS in Chaparral, NM
- 2,15943.9%Rescue & EMS
- 1,35427.5%Good Intent Call
- 91118.5%Fire
- 2254.6%Service Call
- 1412.9%Hazardous Condition
- 871.8%False Alarm
- 260.5%Special Incident
- 100.2%Severe Weather
- Fire incident types reported to NFIRS in Chaparral, NM
- 49354.1%Outside Fires
- 22825.0%Structure Fires
- 11512.6%Other
- 758.2%Mobile Property/Vehicle Fires
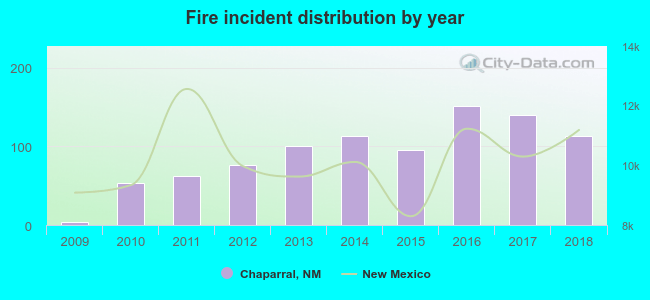 Based on the data from the years 2009 - 2018 the average number of fire incidents per year is 91. The highest number of fires - 152 took place in 2016, and the least - 4 in 2009. The data has a growing trend.
The average number of yearly fire incidents per 10k residents in Chaparral, NM compared to nearest cities:
(Note: Based on data for the last 3 years, including only cities with population 5,000 and above)
| Chaparral: | 92.3 |
| Anthony: | 60.5 |
| Sunland Park: | 25.5 |
| Las Cruces: | 24.8 |
| Fairacres: | 59.4 |
| Alamogordo: | 39.8 |
| Deming: | 84.9 |
 The median response time based on all reported fire incidents is 8 minutes. This is comparable to the New Mexico median value.
The median response time in Chaparral, NM compared to nearest cities:
(Note: Based on data for all years, including only cities with at least 500 fire incidents)
| Chaparral: | 8 minutes |
| Anthony: | 12 minutes |
| Las Cruces: | 6 minutes |
| Alamogordo: | 5 minutes |
| Deming: | 7 minutes |
 22.5% incidents where reported in the morning and 77.5% in the evening. The most fires (15.9%) took place on Monday, and the least (11.3%) on Thursday.
 According to the 911 fire incident reports from years 2009 - 2018 most fires (21.3%) took place during July, and the least (4.7%) in December.
 Out of all 4,915 cases reported during the years 2009 - 2018, the most belonged to the categories: Rescue & EMS (43.9%), Good Intent Call (27.5%), and Fire (18.5%).
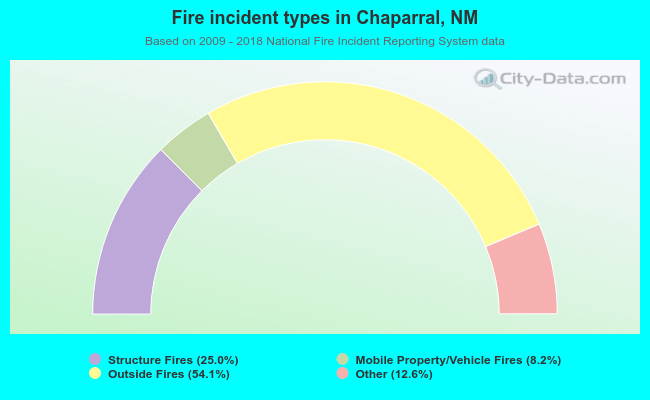 When looking into fire subcategories, the most incidents belonged to: Outside Fires (54.1%), and Structure Fires (25.0%).