Chalfont: Fire Incidents, Pennsylvania (PA)
Where are fire incidents reported in Chalfont, PA
Something went wrong! Please refresh the page.
|
| |||||||||||||||||||||||||||||||||||||||||||||||||||||||||||||||||||||||||||||||||||||||||||||||||||||||||||||
2003 - 2018 National Fire Incident Reporting System (NFIRS) incidents
- Incident types reported to NFIRS in Chalfont, PA
- 46330.1%Fire
- 44929.2%False Alarm
- 38725.2%Hazardous Condition
- 986.4%Rescue & EMS
- 654.2%Good Intent Call
- 583.8%Service Call
- 100.7%Special Incident
- 50.3%Severe Weather
- 20.1%Overpressure Rupture
- Fire incident types reported to NFIRS in Chalfont, PA
- 26757.7%Structure Fires
- 11725.3%Outside Fires
- 5111.0%Other
- 286.0%Mobile Property/Vehicle Fires
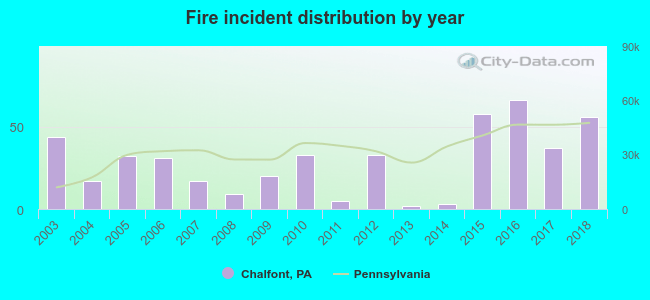 Based on the data from the years 2003 - 2018 the average number of fires per year is 29. The highest number of reported fires - 66 took place in 2016, and the least - 2 in 2013. The data has a rising trend.
 32.0% incidents where reported in the morning and 68.0% in the evening. The most fires (16.8%) took place on Wednesday, and the least (12.3%) on Sunday.
 According to the 463 fire incident reports from years 2003 - 2018 most fires (12.7%) took place during January, and the least (3.9%) in August.
 Out of all 1,537 cases reported during the years 2003 - 2018, the most belonged to the categories: Fire (30.1%), False Alarm (29.2%), and Hazardous Condition (25.2%).
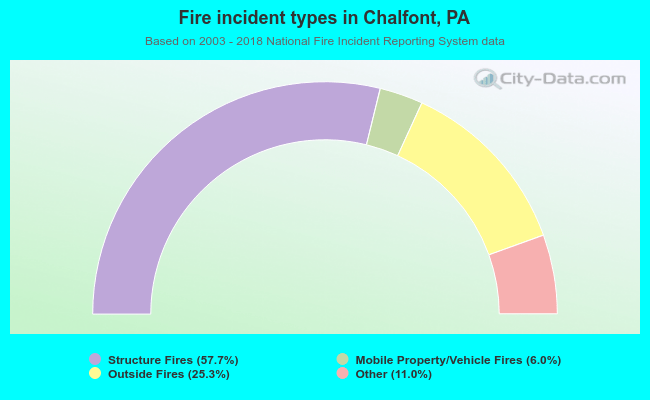 When looking into fire subcategories, the most reports belonged to: Structure Fires (57.7%), and Outside Fires (25.3%).