Celeste: Fire Incidents, Texas (TX)
Where are fire incidents reported in Celeste, TX
Something went wrong! Please refresh the page.
|
| |||||||||||||||||||||||||||||||||||||||||||||||||||||||||||||||||||||||||||||||||||||||||||||||||||||||||||||
2002 - 2018 National Fire Incident Reporting System (NFIRS) incidents
- Incident types reported to NFIRS in Celeste, TX
- 64044.5%Rescue & EMS
- 50034.7%Fire
- 1419.8%Good Intent Call
- 735.1%Hazardous Condition
- 714.9%Service Call
- 120.8%False Alarm
- 20.1%Special Incident
- Fire incident types reported to NFIRS in Celeste, TX
- 35871.6%Outside Fires
- 10020.0%Structure Fires
- 357.0%Mobile Property/Vehicle Fires
- 71.4%Other
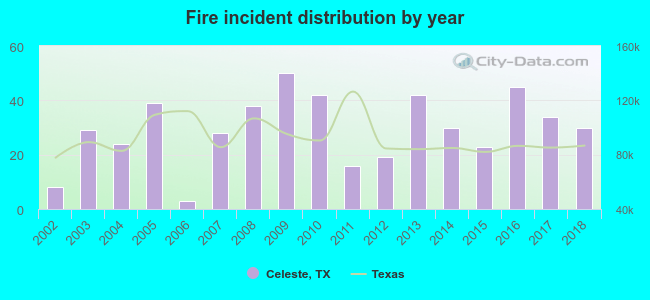 Based on the data from the years 2002 - 2018 the average number of fire incidents per year is 29. The highest number of fires - 50 took place in 2009, and the least - 3 in 2006. The data has a rising trend.
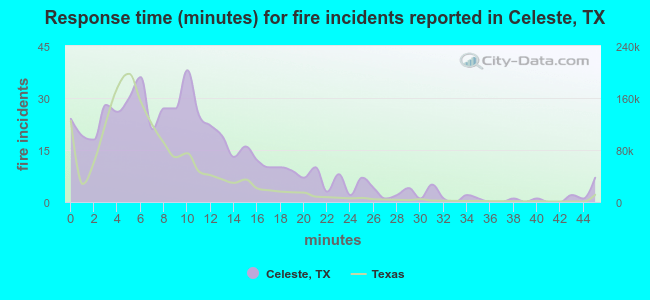 The median response time based on all reported fire incidents is 9 minutes. This is higher compared to the Texas median value.
The median response time in Celeste, TX compared to nearest cities:
(Note: Based on data for all years, including only cities with at least 500 fire incidents)
| Celeste: | 9 minutes |
| Blue Ridge: | 12 minutes |
| Greenville: | 6 minutes |
| Farmersville: | 9 minutes |
| Caddo Mills: | 13 minutes |
| Campbell: | 13 minutes |
| Commerce: | 5 minutes |
| Whitewright: | 11 minutes |
| Princeton: | 11 minutes |
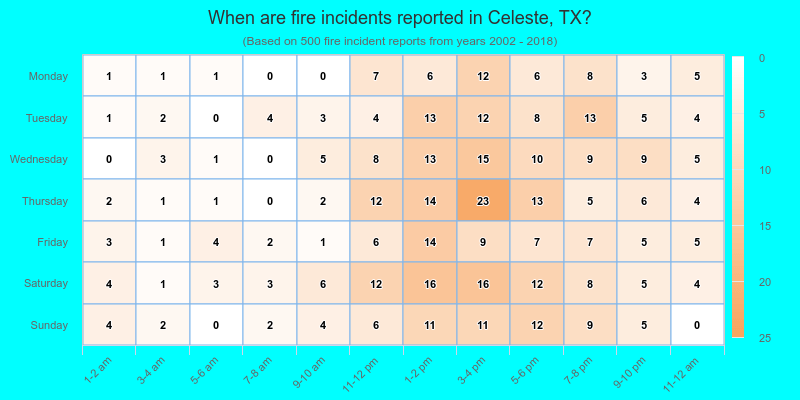
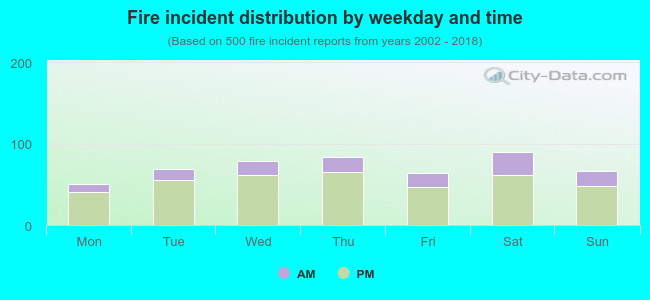 24.6% incidents where reported in the morning and 75.4% in the evening. The most fires (18.0%) took place on Saturday, and the least (10.0%) on Monday.
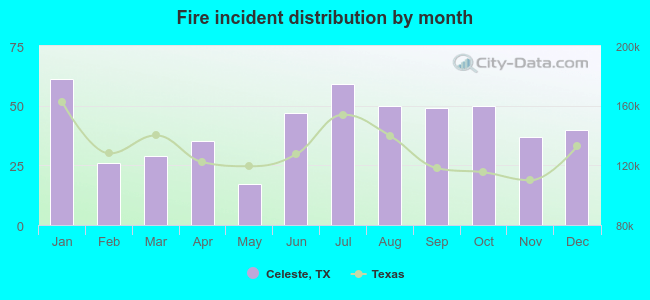 According to the 500 fires from years 2002 - 2018 most fires (12.2%) took place during January, and the least (3.4%) in May.
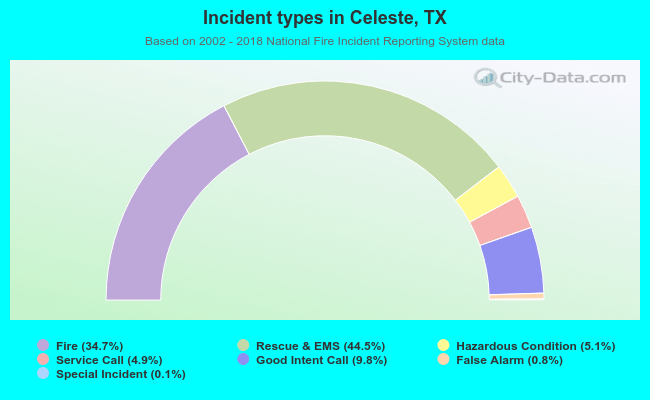 Out of all 1,439 cases reported during the years 2002 - 2018, the most belonged to the categories: Overpressure Rupture (44.5%), Fire (34.7%), and Service Call (9.8%).
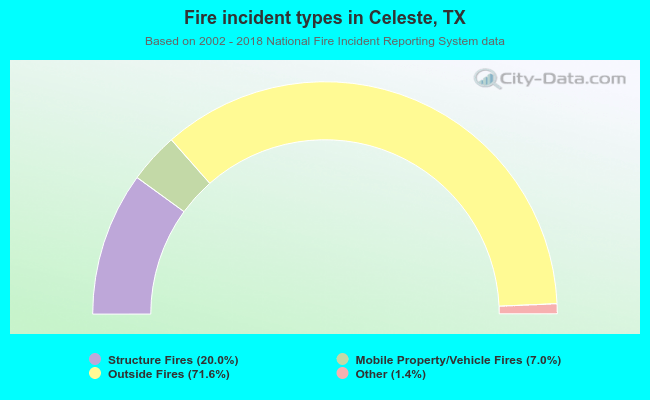 When looking into fire subcategories, the most reports belonged to: Outside Fires (71.6%), and Structure Fires (20.0%).