| Fire incidents reported |
|---|
| Sreet name | Count |
|---|
| HIGHWAY 162 | 28 | | NEAL RD | 16 | | HIGHWAY 59 | 12 | | HIGHWAY 59 NORTH | 12 | | HWY 162 | 8 | | ARMER LN | 6 | | BRAWNER LOOP | 6 | | EQUESTRIAN DR | 6 | | HIGHWAY 220 EAST | 6 | | LUCIANWOOD RD | 6 | | MILL POND RD | 6 | | 10022 HWY. 59 N. | 4 | | 11010 LUCIAN WOOD RD | 4 | | BEWLEY RD | 4 | | BIG CEDAR LN | 4 | | CANDLELIGHT LN | 4 | | HAPPY HOLLOW ROAD | 4 | | HWY 59 NORTH | 4 | | MILL POND | 4 | | N HWY 59 | 4 | | NEAL RD | 4 | | NEAL ROAD | 4 | | NORTH HIGHWAY 59 | 4 | | SUNSET LN | 4 | | THOMPSON LANE | 4 |
| | | Fire incidents reported |
|---|
| Sreet name | Count |
|---|
| 10114 NEAL ROAD | 2 | | 10223 HIGHWAY 59 | 2 | | 10223 HWY 59 | 2 | | 10224 KYLE DRIVE | 2 | | 10524 HIGHWAY 59 | 2 | | 1071 HIGHWAY 162 | 2 | | 1122 DOROTHY DR | 2 | | 11326 LUCIAN WOOD ROAD | 2 | | 11426 LUCIAN WOOD RD | 2 | | 11501 LUCIAN WOOD RD | 2 | | 11501 LUCIANWOOD ROAD | 2 | | 11616 LUCIAN WOOD ROAD | 2 | | 1203 DEER TRAIL | 2 | | 1222 LITTLE WEBBER | 2 | | 1516 DORTHY DRIVE | 2 | | 16534 DRY HILL LOOP | 2 | | 1937 HIGHWAY 162 | 2 | | 2603 HIGHWAY 162 | 2 | | 300 HWY 162 | 2 | | 324 BOWEN DR | 2 | | 336 HWY 162 | 2 | | 499 HWY 162 | 2 | | 600 BLOCK BRAWNER LOOP | 2 | | 723 HOMESTEAD LANE | 2 | | |
|
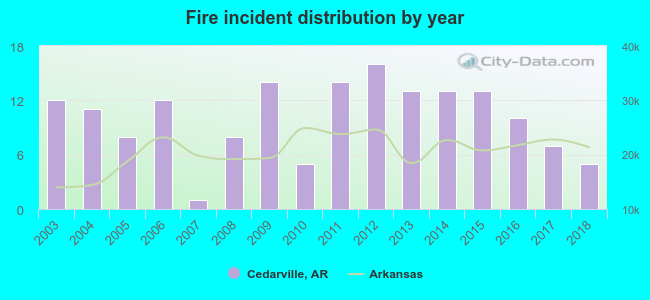 According to the data from the years 2003 - 2018 the average number of fires per year is 10. The highest number of fire incidents - 16 took place in 2012, and the least - 1 in 2007. The data has a dropping trend.
 27.2% incidents where reported in the morning and 72.8% in the evening. The most fires (17.3%) took place on Tuesday, and the least (11.1%) on Monday.
 Based on the 162 incident reports from years 2003 - 2018 most fires (19.1%) took place during January, and the least (3.7%) in November.
 Out of all 376 cases reported during the years 2003 - 2018, the most belonged to the categories: Fire (43.1%), Overpressure Rupture (42.6%), and Service Call (7.4%).
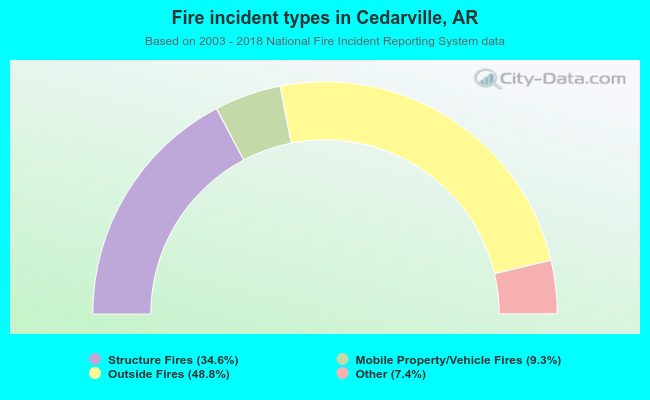 When looking into fire subcategories, the most incidents belonged to: Outside Fires (48.8%), and Structure Fires (34.6%).