| Fire incidents reported |
|---|
| Sreet name | Count |
|---|
| SR 24 | 36 | | HWY 24 | 32 | | CR 347 | 28 | | HWY 347 | 20 | | DOCK STREET | 10 | | SHELLMOUND ROAD | 10 | | SHILOH ROAD | 10 | | CR 345 | 8 | | 126TH AVE | 6 | | 13691 SW 67TH PLACE | 6 | | 71 LN | 6 | | AIRPORT ROAD | 6 | | COUNTY ROAD 347 HWY | 6 | | D STREET | 6 | | GULF BLVD | 6 | | NA | 6 | | WHIDDON AVE | 6 | | 11 OLD MILL DRIVE | 4 | | 12530 LIVE OAK STREET | 4 | | 13951 SW 77TH PLACE | 4 | | 450 DOCK STREET | 4 | | 490 DOCK STREET | 4 | | 52 PL | 4 | | 66TH PL | 4 | | CK PLANTATION | 4 |
| | | Fire incidents reported |
|---|
| Sreet name | Count |
|---|
| COUNTY ROAD 345 HWY | 4 | | DEPOT STREET | 4 | | HODGES AVE | 4 | | STATE ROAD 24 HWY | 4 | | STATE ROAD 24 RD | 4 | | SW 105 AVE | 4 | | SW 60TH STREET | 4 | | WILEY ROAD | 4 | | 10050 SW CR 347 | 2 | | 10251 SW 52ND PLACE | 2 | | 1026 WHIDDON AVE. | 2 | | 10270 PARKS ROAD | 2 | | 103 | 2 | | 103RD | 2 | | 103RD CT | 2 | | 10405 NW 60TH STREET | 2 | | 105 AVE | 2 | | 10551 SW 55 STREET | 2 | | 108 AVE | 2 | | 10831 108 AVE. | 2 | | 109 CT | 2 | | 109 CT | 2 | | 11030 SW 71ST LANE | 2 | | 1109 PALMETTO DRIVE | 2 | | |
|
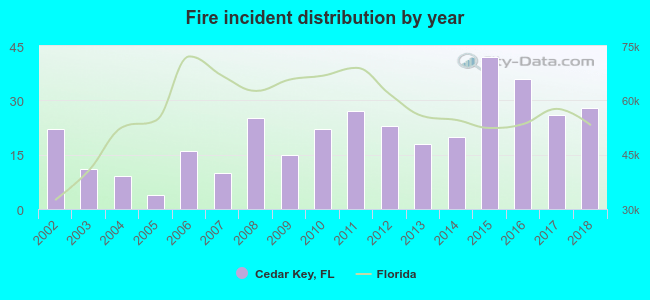 According to the data from the years 2002 - 2018 the average number of fire incidents per year is 21. The highest number of fire incidents - 42 took place in 2015, and the least - 4 in 2005. The data has an increasing trend.
 24.3% incidents where reported in the morning and 75.7% in the evening. The most fires (17.5%) took place on Saturday, and the least (10.7%) on Friday.
 According to the 354 incident reports from years 2002 - 2018 most fires (15.8%) took place during June, and the least (4.0%) in December.
 Out of all 2,281 cases reported during the years 2002 - 2018, the most belonged to the categories: Rescue & EMS (67.5%), Fire (15.5%), and Good Intent Call (7.8%).
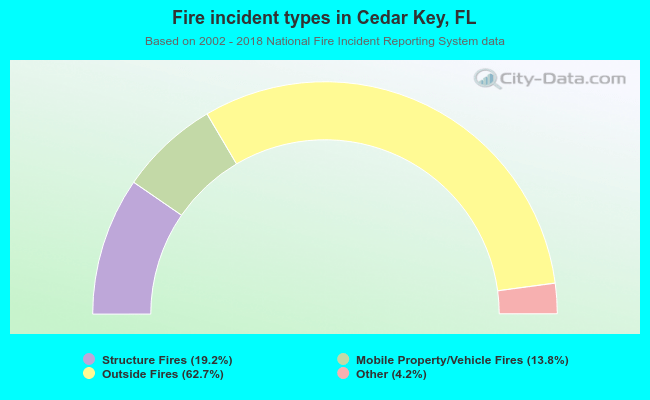 When looking into fire subcategories, the most incidents belonged to: Outside Fires (62.7%), and Structure Fires (19.2%).