| Fire incidents reported |
|---|
| Sreet name | Count |
|---|
| INTERSTATE 40 | 48 | | HIGHWAY 104 | 38 | | HIGHWAY 70 | 28 | | GRIGGS CHAPEL ROAD | 14 | | HIGHWAY 220 | 14 | | RUE HAMNER RD | 14 | | OBRIEN RD | 12 | | HWY 104 | 10 | | MT GILEAD RD | 10 | | PEAR RD | 10 | | FERGUSON CEMETERY ROAD | 8 | | GRIGGS CHAPEL RD | 8 | | LEO WOODS RD | 8 | | PARKER STORE ROAD | 8 | | GRIGGS CHAPEL ROAD HWY 70 | 6 | | HIGHWAY 104 | 6 | | HIGHWAY 104 W | 6 | | MOSS CREEK ROAD | 6 | | O'BRIEN RD | 6 | | ROCK MILAM RD | 6 | | RUE HAMNER RD | 6 | | TERRY RD | 6 | | TERRY ROAD | 6 | | WILLIAMS LN | 6 | | 2575 HWY 70 | 4 |
| | | Fire incidents reported |
|---|
| Sreet name | Count |
|---|
| 3355 GRIGGS CHAPEL ROAD | 4 | | 70 HWY | 4 | | 7940 TERRY ROAD | 4 | | BAUDY JAMES RD | 4 | | HIGHWAY 424 | 4 | | HOPEWELL RD | 4 | | NEW BETHEL ROAD | 4 | | OLD LAVINIA ROAD | 4 | | WALLER RD | 4 | | WATER TOWER ROAD | 4 | | WHITE CEM RD | 4 | | WISE RD | 4 | | 1020 OLD LAVINIA ROAD | 2 | | 123 MOSS CREEK ROAD | 2 | | 1456 HWY 220 | 2 | | 1505 GRIGGS CHAPEL ROAD | 2 | | 1525 LITTLE GROVE ROAD | 2 | | 164 FLAT BOTTOM ROAD | 2 | | 165 CUNNINGHAM ROAD | 2 | | 1710 HOOD LANE | 2 | | 1960 HIGHWAY 424 | 2 | | 215 GARDNER ROAD | 2 | | 23 CHARLES LANE | 2 | | 25 GRIGGS CHAPEL ROAD | 2 | | |
|
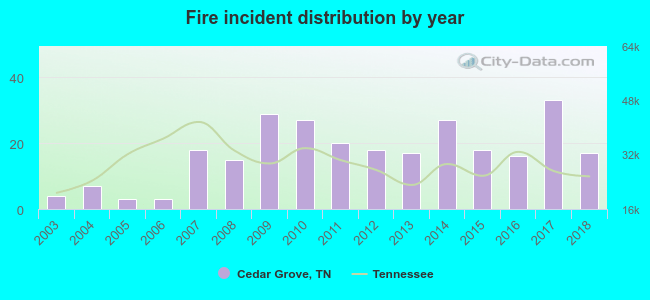 Based on the data from the years 2003 - 2018 the average number of fires per year is 17. The highest number of reported fires - 33 took place in 2017, and the least - 3 in 2005. The data has an increasing trend.
 33.1% incidents where reported in the morning and 66.9% in the evening. The most fires (18.0%) took place on Monday, and the least (11.4%) on Tuesday.
 According to the 272 incident reports from years 2003 - 2018 most fires (11.0%) took place during August, and the least (3.3%) in September.
 Out of all 428 cases reported during the years 2003 - 2018, the most belonged to the categories: Fire (63.6%), Overpressure Rupture (15.4%), and Service Call (11.7%).
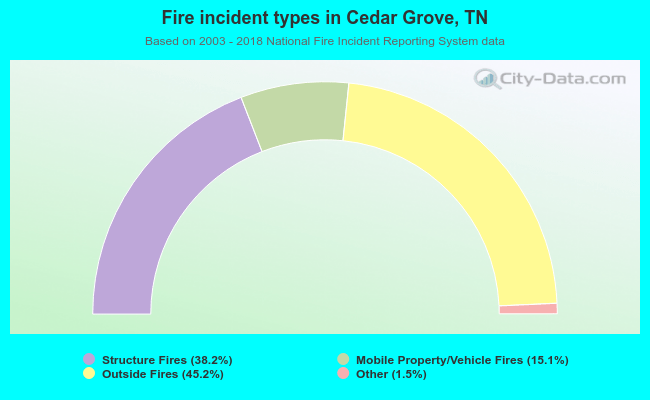 When looking into fire subcategories, the most incidents belonged to: Outside Fires (45.2%), and Structure Fires (38.2%).