| Fire incidents reported |
|---|
| Sreet name | Count |
|---|
| MAIN STREET | 12 | | ROUTE 131 | 12 | | RT 131 | 10 | | RTE 131 | 10 | | MAIN ST | 8 | | BROOK ROAD | 6 | | KNAPP POND RD | 6 | | 2351 MAIN STREET | 4 | | 2702 BROOK ROAD | 4 | | 78 MILL STREET | 4 | | 935 CENTER ROAD | 4 | | CAVENDISH GULF RD | 4 | | CENTER ROAD | 4 | | DAVIS ROAD | 4 | | LINDBERG DRIVE | 4 | | MAIN ST | 4 | | MILL STREET | 4 | | TIERNEY ROAD | 4 | | TWENTY MILE STREAM ROAD | 4 | | 1000 HIGH ST | 2 | | 1005 TARBELL HILL ROAD | 2 | | 104 RODGERS DRIVE | 2 | | 1043 MAIN ST | 2 | | 1521 BROOK ROAD | 2 | | 1931 MAIN STREET | 2 |
| | | Fire incidents reported |
|---|
| Sreet name | Count |
|---|
| 1932 MAIN STREET | 2 | | 1963 HEALD ROAD | 2 | | 20 MILE STREAM ROAD | 2 | | 2041 MAIN STREET | 2 | | 2285 BROOK RD | 2 | | 2494 CAVENDISH GULF RD | 2 | | 2494 TARBELL HILL ROAD | 2 | | 263 RT 106 | 2 | | 2702 BROOK RD | 2 | | 277 SENNA RD | 2 | | 293 RT 106 | 2 | | 293 RTE 106 | 2 | | 294 MAIN ST | 2 | | 441 CENTER ROAD | 2 | | 57 MILL STREET | 2 | | 610 TARBELL HILL RD | 2 | | 644 HIGH STREET | 2 | | 646 ATKINSON ROAD | 2 | | 67 MILL STREET | 2 | | 700 HIGH STREET | 2 | | 729 DAVIS RD | 2 | | 834 ROUTE 131 | 2 | | 834 VT RTE 131 | 2 | | 90 RANNEY HILL RD | 2 | | 90 RANNEY HILL ROAD | 2 |
|
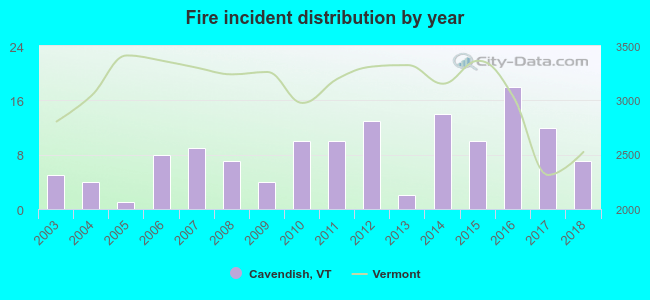 According to the data from the years 2003 - 2018 the average number of fires per year is 8. The highest number of fire incidents - 18 took place in 2016, and the least - 1 in 2005. The data has an increasing trend.
 32.1% incidents where reported in the morning and 67.9% in the evening. The most fires (20.1%) took place on Wednesday, and the least (11.2%) on Saturday.
 Based on the 134 reports from years 2003 - 2018 most fires (17.9%) took place during February, and the least (1.5%) in November.
 Out of all 510 cases reported during the years 2003 - 2018, the most belonged to the categories: Overpressure Rupture (42.5%), Fire (26.3%), and Rescue & EMS (15.5%).
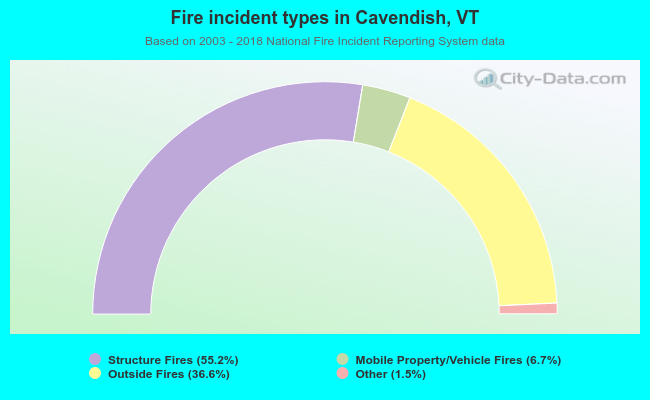 When looking into fire subcategories, the most incidents belonged to: Structure Fires (55.2%), and Outside Fires (36.6%).