Catlin: Fire Incidents, Illinois (IL)
Where are fire incidents reported in Catlin, IL
Something went wrong! Please refresh the page.
|
| |||||||||||||||||||||||||||||||||||||||||||||||||||||||||||||||||||||||||||||||||||||||||||||||||||||||||||||
2002 - 2018 National Fire Incident Reporting System (NFIRS) incidents
- Incident types reported to NFIRS in Catlin, IL
- 36537.1%Rescue & EMS
- 27628.1%Fire
- 13213.4%Good Intent Call
- 10710.9%Hazardous Condition
- 636.4%Service Call
- 353.6%False Alarm
- 30.3%Special Incident
- 20.2%Overpressure Rupture
- Fire incident types reported to NFIRS in Catlin, IL
- 13448.6%Structure Fires
- 9634.8%Outside Fires
- 279.8%Mobile Property/Vehicle Fires
- 196.9%Other
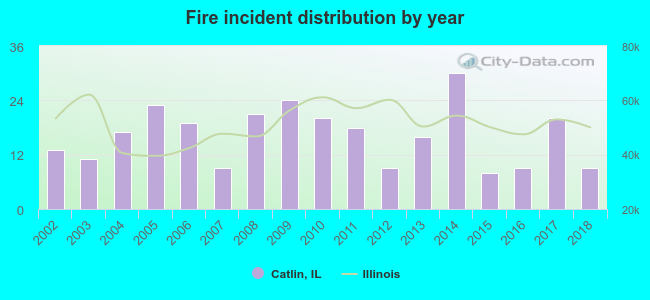 Based on the data from the years 2002 - 2018 the average number of fire incidents per year is 16. The highest number of fire incidents - 30 took place in 2014, and the least - 8 in 2015. The data has a dropping trend.
 28.6% incidents where reported in the morning and 71.4% in the evening. The most fires (21.4%) took place on Tuesday, and the least (9.1%) on Wednesday.
 Based on the 276 fire incidents from years 2002 - 2018 most fires (14.5%) took place during November, and the least (2.2%) in August.
 Out of all 983 cases reported during the years 2002 - 2018, the most belonged to the categories: Rescue & EMS (37.1%), Fire (28.1%), and Good Intent Call (13.4%).
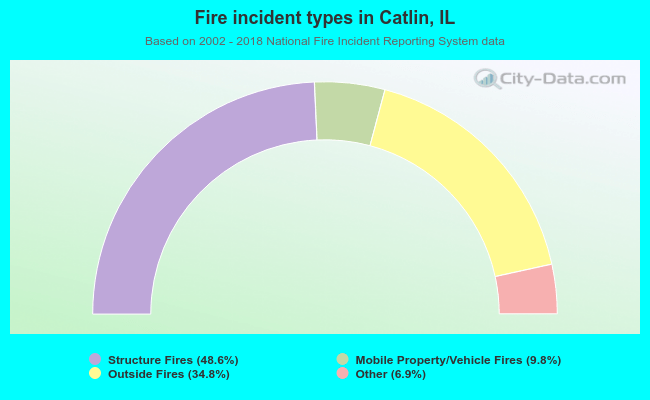 When looking into fire subcategories, the most reports belonged to: Structure Fires (48.6%), and Outside Fires (34.8%).