Castle Rock: Fire Incidents, Washington (WA)
Where are fire incidents reported in Castle Rock, WA
Something went wrong! Please refresh the page.
|
| |||||||||||||||||||||||||||||||||||||||||||||||||||||||||||||||||||||||||||||||||||||||||||||||||||||||||||||
| Other | 239 | |||||||||||||||||||||||||||||||||||||||||||||||||||||||||||||||||||||||||||||||||||||||||||||||||||||||||||||
2002 - 2018 National Fire Incident Reporting System (NFIRS) incidents
- Incident types reported to NFIRS in Castle Rock, WA
- 4,32560.8%Rescue & EMS
- 1,18516.7%Fire
- 75310.6%Good Intent Call
- 3274.6%Service Call
- 2493.5%False Alarm
- 2193.1%Hazardous Condition
- 420.6%Special Incident
- 80.1%Overpressure Rupture
- Fire incident types reported to NFIRS in Castle Rock, WA
- 45638.5%Structure Fires
- 34729.3%Outside Fires
- 26422.3%Mobile Property/Vehicle Fires
- 11810.0%Other
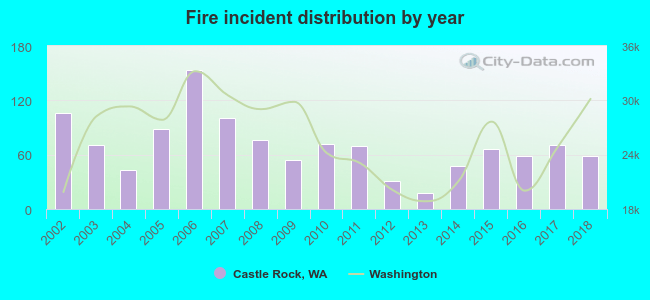 According to the data from the years 2002 - 2018 the average number of fire incidents per year is 70. The highest number of fires - 153 took place in 2006, and the least - 18 in 2013. The data has a dropping trend.
 The median response time based on all reported fire incidents is 9 minutes. This is higher than the state median value.
The median response time in Castle Rock, WA compared to nearest cities:
(Note: Based on data for all years, including only cities with at least 500 fire incidents)
| Castle Rock: | 9 minutes |
| Kelso: | 7 minutes |
| Longview: | 5 minutes |
| Toledo: | 11 minutes |
| Winlock: | 11 minutes |
| Woodland: | 7 minutes |
| Chehalis: | 7 minutes |
| Centralia: | 6 minutes |
| Ridgefield: | 7 minutes |
 32.3% incidents where reported in the morning and 67.7% in the evening. The most fires (15.9%) took place on Sunday, and the least (12.7%) on Tuesday.
 Based on the 1,185 incident reports from years 2002 - 2018 most fires (14.5%) took place during July, and the least (5.7%) in January.
 Out of all 7,114 cases reported during the years 2002 - 2018, the most belonged to the categories: Rescue & EMS (60.8%), Fire (16.7%), and Good Intent Call (10.6%).
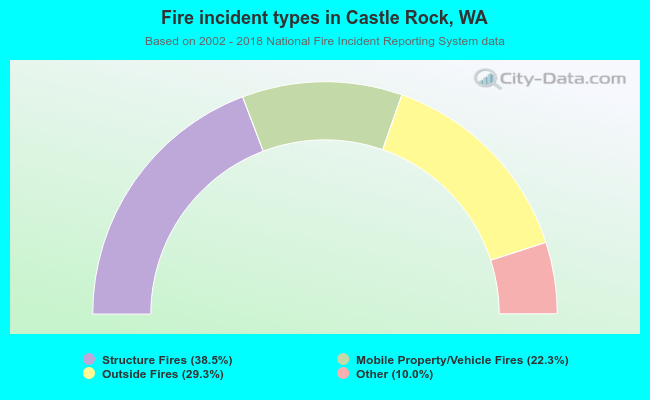 When looking into fire subcategories, the most reports belonged to: Structure Fires (38.5%), and Outside Fires (29.3%).