Casper: Fire Incidents, Wyoming (WY)
Where are fire incidents reported in Casper, WY
Something went wrong! Please refresh the page.
| Fire incidents reported | |
|---|---|
| Sreet name | Count |
| 2ND ST | 90 |
| CY AVE | 70 |
| 12TH ST | 58 |
| POPLAR ST | 56 |
| WYOMING BLVD | 54 |
| STATION RD | 52 |
| MCKINLEY ST | 48 |
| 20-26 HWY | 46 |
| CASPER MOUNTAIN RD | 40 |
| CENTER ST | 38 |
| 15TH ST | 32 |
| YELLOWSTONE HWY | 30 |
| JEFFERSON ST | 28 |
| SALT CREEK HIGHWAY | 28 |
| K ST | 26 |
| POISON SPIDER RD | 26 |
| SALT CREEK HWY | 26 |
| WOLCOTT ST | 26 |
| 18TH ST | 24 |
| HONEYSUCKLE | 24 |
| ROBERTSON RD | 24 |
| WALSH DR | 24 |
| BEECH ST | 22 |
| LINCOLN ST | 22 |
| WASHINGTON ST | 22 |
| ZERO RD | 22 |
| 1ST ST | 20 |
| A ST | 20 |
| BOULDER DR | 20 |
| BRYAN STOCK TRL | 20 |
| Other | 1,217 |
2002 - 2018 National Fire Incident Reporting System (NFIRS) incidents
- Incident types reported to NFIRS in Casper, WY
- 10,92955.0%Rescue & EMS
- 2,76713.9%Good Intent Call
- 2,25511.3%Fire
- 1,9009.6%Hazardous Condition
- 1,2046.1%Service Call
- 7944.0%False Alarm
- Fire incident types reported to NFIRS in Casper, WY
- 87338.7%Outside Fires
- 82336.5%Structure Fires
- 37516.6%Mobile Property/Vehicle Fires
- 1848.2%Other
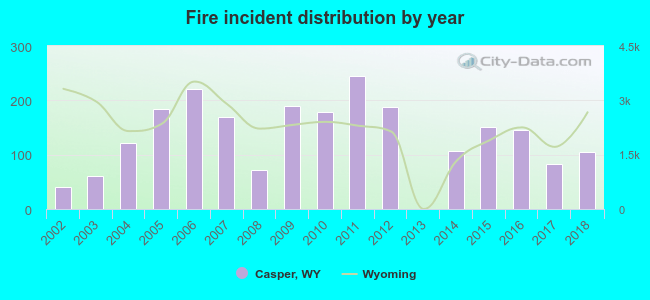 According to the data from the years 2002 - 2018 the average number of fires per year is 133. The highest number of reported fire incidents - 244 took place in 2011, and the least - 0 in 2013. The data has a growing trend.
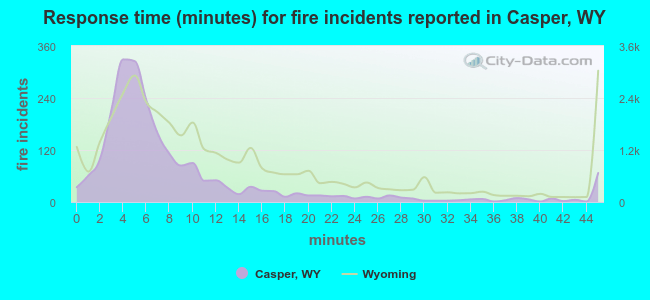 The median response time based on all reported fire incidents is 6 minutes. This is lower compared to the state median value.
The median response time in Casper, WY compared to nearest cities:
(Note: Based on data for all years, including only cities with at least 500 fire incidents)
| Casper: | 6 minutes |
| Douglas: | 23 minutes |
| Wright: | 23 minutes |
| Rawlins: | 7 minutes |
| Wheatland: | 14 minutes |
| Riverton: | 8 minutes |
| Thermopolis: | 11 minutes |
| Laramie: | 10 minutes |
| Worland: | 5 minutes |
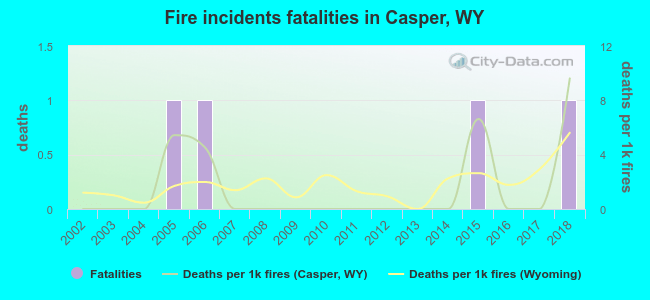 Based on the data from the years 2002 - 2018 the average number of fire-related yearly deaths is 0. The highest number of reported deaths - 1 took place in 2005, and the lowest - 0 in 2002. The data has a rising trend.
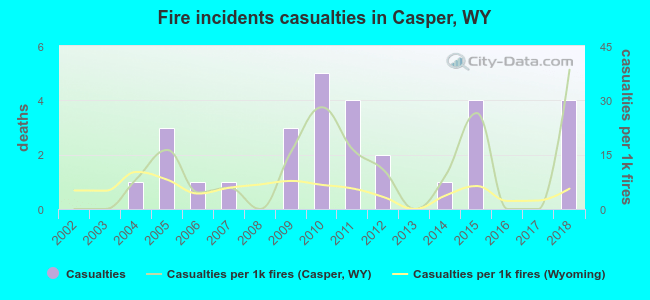 Based on the reports from the years 2002 - 2018 the average number of fire-related casualties per year is 2. The highest number of injuries - 5 took place in 2010, and the lowest - 0 in 2002. The data has a rising trend.
The average number of casualties per 1,000 fire incidents is 11. This indicator was the highest - 38 in 2018, and the lowest 0 in 2002. The trend for injuries per 1,000 incidents is increasing. Compared to the Wyoming value the number of casualties per 1,000 fire incidents is much higher.
Based on the reports from the years 2002 - 2018 the average number of fire-related casualties per year is 2. The highest number of injuries - 5 took place in 2010, and the lowest - 0 in 2002. The data has a rising trend.
The average number of casualties per 1,000 fire incidents is 11. This indicator was the highest - 38 in 2018, and the lowest 0 in 2002. The trend for injuries per 1,000 incidents is increasing. Compared to the Wyoming value the number of casualties per 1,000 fire incidents is much higher.
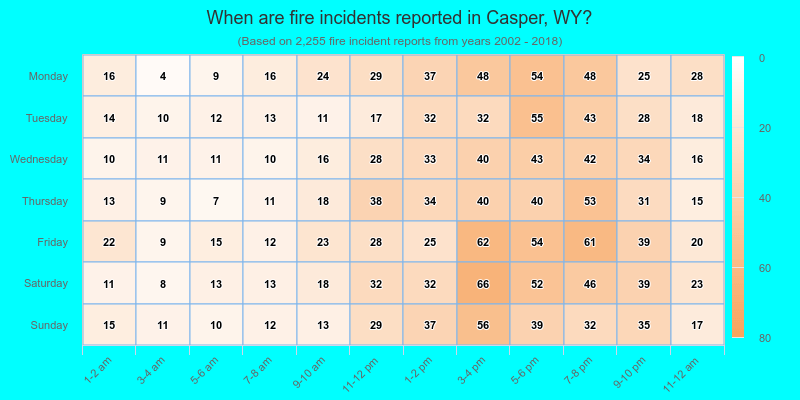
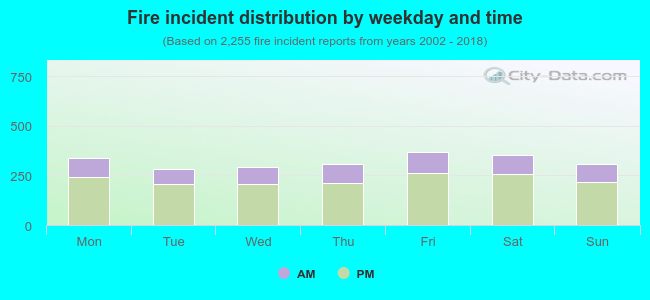 28.9% incidents where reported in the morning and 71.1% in the evening. The most fires (16.4%) took place on Friday, and the least (12.6%) on Tuesday.
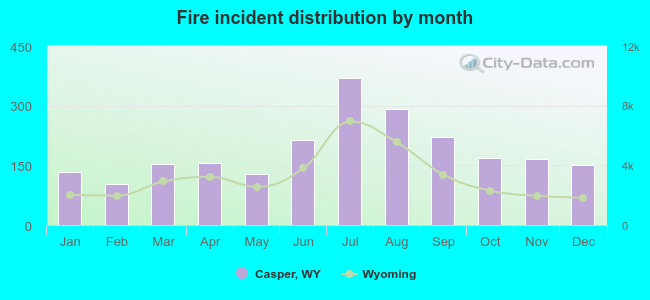 Based on the 2,255 fire incidents from years 2002 - 2018 most fires (16.4%) took place during July, and the least (4.6%) in February.
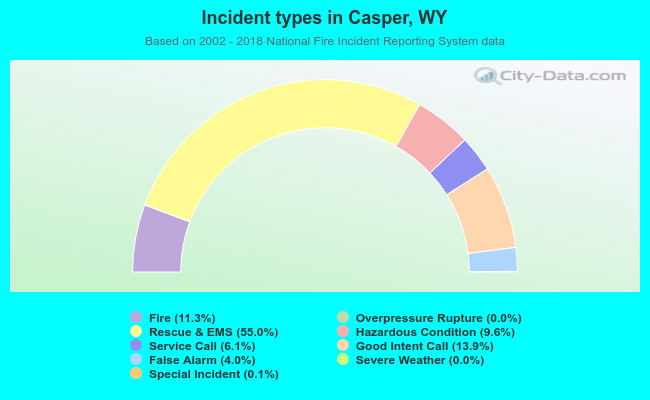 Out of all 19,869 cases reported during the years 2002 - 2018, the most belonged to the categories: Rescue & EMS (55.0%), Good Intent Call (13.9%), and Fire (11.3%).
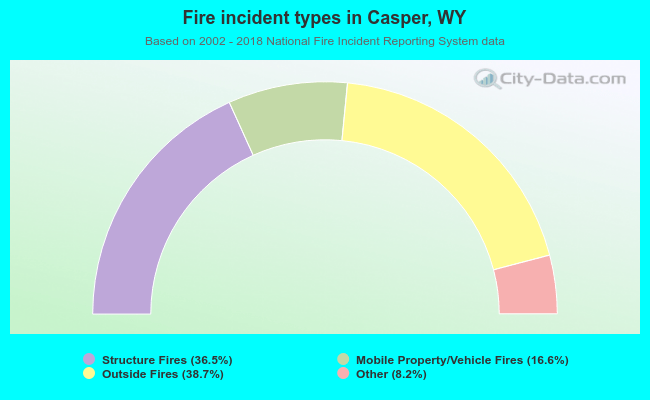 When looking into fire subcategories, the most reports belonged to: Outside Fires (38.7%), and Structure Fires (36.5%).