Casey: Fire Incidents, Illinois (IL)
Where are fire incidents reported in Casey, IL
Something went wrong! Please refresh the page.
|
| |||||||||||||||||||||||||||||||||||||||||||||||||||||||||||||||||||||||||||||||||||||||||||||||||||||||||||||
2002 - 2018 National Fire Incident Reporting System (NFIRS) incidents
- Incident types reported to NFIRS in Casey, IL
- 21963.7%Fire
- 4312.5%Rescue & EMS
- 329.3%Hazardous Condition
- 247.0%False Alarm
- 205.8%Good Intent Call
- 51.5%Service Call
- 10.3%Overpressure Rupture
- Fire incident types reported to NFIRS in Casey, IL
- 9744.3%Structure Fires
- 8237.4%Outside Fires
- 2812.8%Mobile Property/Vehicle Fires
- 125.5%Other
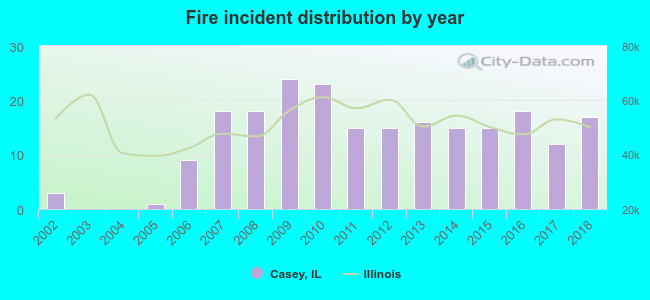 Based on the data from the years 2002 - 2018 the average number of fire incidents per year is 13. The highest number of fire incidents - 24 took place in 2009, and the least - 0 in 2003. The data has a growing trend.
 Based on the reports from the years 2002 - 2018 the average number of fire-related yearly casualties is 0. The highest number of reported injuries - 4 took place in 2016, and the lowest - 0 in 2002. The data has a constant trend.
 28.3% incidents where reported in the morning and 71.7% in the evening. The most fires (17.8%) took place on Sunday, and the least (10.0%) on Friday.
 Based on the 219 fire incident reports from years 2002 - 2018 most fires (12.3%) took place during January, and the least (4.1%) in December.
 Out of all 344 cases reported during the years 2002 - 2018, the most belonged to the categories: Fire (63.7%), Rescue & EMS (12.5%), and Hazardous Condition (9.3%).
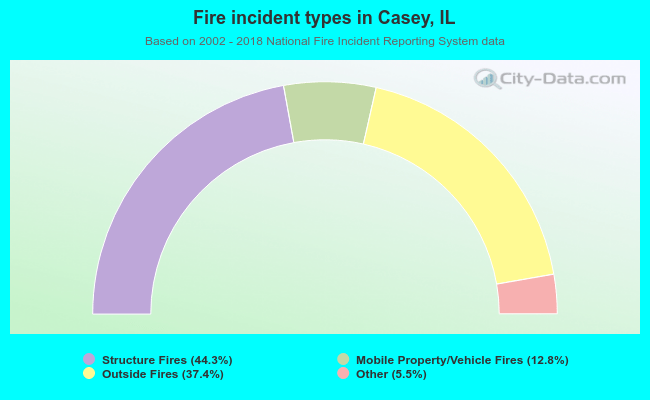 When looking into fire subcategories, the most incidents belonged to: Structure Fires (44.3%), and Outside Fires (37.4%).