| Fire incidents reported |
|---|
| Sreet name | Count |
|---|
| INTERSTATE 84 FWY | 40 | | FOREST LN | 32 | | WANAPA ST | 28 | | FRONTAGE RD | 10 | | I 84 FWY | 10 | | INTERSTATE 84 | 8 | | TAHOMA ST | 8 | | MOODY ST | 6 | | 362 AVE | 4 | | CASCADE AVE | 4 | | CASCADE LOCKS | 4 | | FOREST LANE LN | 4 | | HARVEST QUEEN ST | 4 | | HERMAN CREEK LN | 4 | | I-84 FWY | 4 | | I84 EB MP 47 | 4 | | I84 EB MP 48 | 4 | | PORTAGE RD | 4 | | PORTAGE ROAD RD | 4 | | RUCKEL ST | 4 | | RUCKLE ST | 4 | | WA NA PA ST | 4 | | 14 W OF BRIDGEN OF TRACKS | 2 | | 15 HERMAN CREEK LANE | 2 | | 221 NE WALNUT ST | 2 |
| | | Fire incidents reported |
|---|
| Sreet name | Count |
|---|
| 25 WANAPA ST | 2 | | 404 WANAPA ST | 2 | | 5 CRAMBLETT WAY | 2 | | 5 NE CRAMBLETT WAY | 2 | | 745 WANAPA ST | 2 | | 8 RUCKEL ST | 2 | | 965 FOREST LN | 2 | | 965 FOREST LN15 | 2 | | BEAR MTN LUMBER | 2 | | BENSON ST | 2 | | BFE | 2 | | BLACKBERRY BEACH TURNAROUND | 2 | | CACASDE LOCKS | 2 | | CELL TOWERS UP DRY CREEK RD | 2 | | CHARBURGER RESTAURANT | 2 | | CL IN LIEU SITE | 2 | | EAGLE CREEKLOOP | 2 | | EB I 84 MP35 FWY | 2 | | EDGEWOOD ST | 2 | | FOREST LANE | 2 | | FOREST LANE HERMAN CREEK OVE | 2 | | GOVERNMENT ISLAND ACCESS ROAD | 2 | | GRAVEL PIT | 2 | | GRAVEL PIT RD | 2 | | HAMMOND | 2 |
|
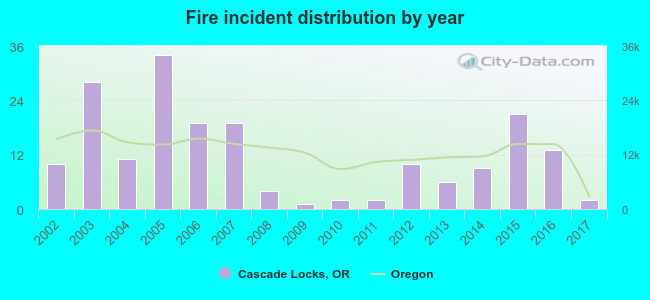 According to the data from the years 2002 - 2017 the average number of fire incidents per year is 12. The highest number of reported fires - 34 took place in 2005, and the least - 1 in 2009. The data has a decreasing trend.
 34.0% incidents where reported in the morning and 66.0% in the evening. The most fires (18.8%) took place on Saturday, and the least (7.9%) on Wednesday.
 Based on the 191 reports from years 2002 - 2017 most fires (16.2%) took place during August, and the least (3.1%) in October.
 Out of all 704 cases reported during the years 2002 - 2017, the most belonged to the categories: Rescue & EMS (50.9%), Fire (27.1%), and Good Intent Call (9.9%).
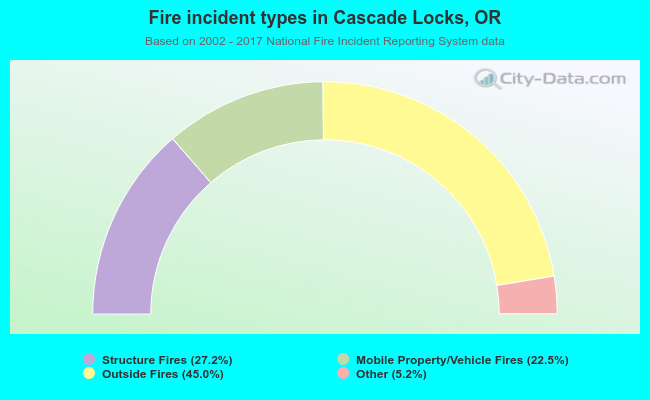 When looking into fire subcategories, the most incidents belonged to: Outside Fires (45.0%), and Structure Fires (27.2%).