| Fire incidents reported |
|---|
| Sreet name | Count |
|---|
| 11 N MARION | 4 | | 136 HWY | 4 | | 1638 NORTH COUNTY RD 2300 | 4 | | 2626 E CO RD 1840 | 4 | | 2650 EAST | 4 | | 2800 E 1800 N | 4 | | 2921 E CO RD 1700 | 4 | | 411 MAIN | 4 | | ADAMS | 4 | | CO ROAD 1300 | 4 | | HWY 94 | 4 | | 100 BUCHANAN | 2 | | 1000 N CR 2500 E | 2 | | 1000 NORTH | 2 | | 1002 WALNUT | 2 | | 1018 MAIN STREET | 2 | | 1034 LOCUST | 2 | | 1050 NCR 1800 | 2 | | 1050 NORTH COUNTY RD 2400 EAST | 2 | | 11 N. FAYETTE | 2 | | 110 NORTH MADISON STREET | 2 | | 1100 ECR 900 | 2 | | 1100 WALBASH | 2 | | 1140 N CR 1600 | 2 | | 115 SOUTH HEAD STREET | 2 |
| | | Fire incidents reported |
|---|
| Sreet name | Count |
|---|
| 1150NCR WEST OF BASCO | 2 | | 1180 NORTH COUNTY RD 2200 | 2 | | 120 MAIN | 2 | | 1200 N | 2 | | 1209 MAIN | 2 | | 122 SOUTH ADAMS | 2 | | 1224 MAIN ST | 2 | | 124 SOUTH HEAD | 2 | | 1295 N CO RD 2450 E | 2 | | 130 E. MAIN | 2 | | 1300 EAST | 2 | | 1300 WABASH | 2 | | 1320 N CR 1600 | 2 | | 136 AND 2ND ST. | 2 | | 1400 EAST 1600 NORTH | 2 | | 1405 & 94 | 2 | | 1425 NCR 2350 12 E | 2 | | 1450 E CO ROAD 800 | 2 | | 1450E RD | 2 | | 1454 NCR2050 | 2 | | 1495 N HWY 94 | 2 | | 1500 N CR 1350 | 2 | | 1509 E CR 2100 | 2 | | 1510 E CR 1800 | 2 | | |
|
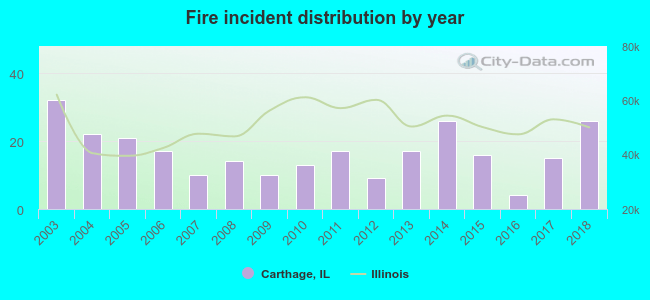 According to the data from the years 2003 - 2018 the average number of fires per year is 17. The highest number of reported fires - 32 took place in 2003, and the least - 4 in 2016. The data has a dropping trend.
 37.5% incidents where reported in the morning and 62.5% in the evening. The most fires (19.3%) took place on Friday, and the least (11.2%) on Wednesday.
 According to the 269 fire incidents from years 2003 - 2018 most fires (17.1%) took place during April, and the least (4.1%) in June.
 Out of all 471 cases reported during the years 2003 - 2018, the most belonged to the categories: Fire (57.1%), Rescue & EMS (14.9%), and Hazardous Condition (11.7%).
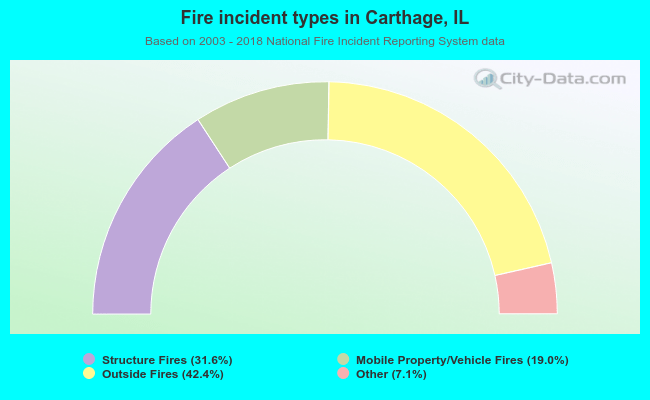 When looking into fire subcategories, the most incidents belonged to: Outside Fires (42.4%), and Structure Fires (31.6%).