| Fire incidents reported |
|---|
| Sreet name | Count |
|---|
| CARROLLTON BLVD | 166 | | SMITHS NECK RD | 66 | | BREWERS NECK BLVD | 44 | | BENNS CHURCH BLVD | 36 | | SUGAR HILL RD | 26 | | NIKE PARK RD | 22 | | GREEN ACRES LN | 16 | | REYNOLDS DR | 14 | | GREENFIELD CT | 12 | | TITUS CREEK DR | 12 | | VELLINES LN | 12 | | AUCKLAND CT | 10 | | BARTLETT CIR | 10 | | CEDAR GROVE RD | 10 | | WHIPPENHAM PKY | 10 | | WIGWAM CIR | 10 | | CANNON DR | 8 | | HAYNES LN | 8 | | MARSH VIEW CT | 8 | | BOUNDARY RD | 6 | | CHANNEL WAY | 6 | | LIBERTY WAY | 6 | | MUDDY COVE CIR | 6 | | SHELL BANK RD | 6 | | TAN RD | 6 |
| | | Fire incidents reported |
|---|
| Sreet name | Count |
|---|
| WALNUT GROVE LN | 6 | | WHIPPINGHAM PKWY | 6 | | ASHBY WAY | 4 | | BALTIMORE LANE | 4 | | BATISTE CT | 4 | | BROWNS MARINA RD | 4 | | BUSH CREEK CIR | 4 | | CENTER ST | 4 | | CHERRY GROVE RD | 4 | | COL HOGAN LN | 4 | | DEEP BOTTOM DR | 4 | | FOUNDERS POINTE TRL | 4 | | GREGORY DR | 4 | | HARBOR TOWNE DR | 4 | | HILL WAY | 4 | | IWIP RD | 4 | | JAMES RIVER BRIDGE | 4 | | KINGS COVE WAY | 4 | | NEW TOWNE HAVEN LN | 4 | | OGILVY LN | 4 | | OWEN FARM RD | 4 | | RAGGED ISLAND | 4 | | RIDDICK RD | 4 | | SANDY RIDGE DR | 4 | | SEAGULL VIEW LN | 4 |
|
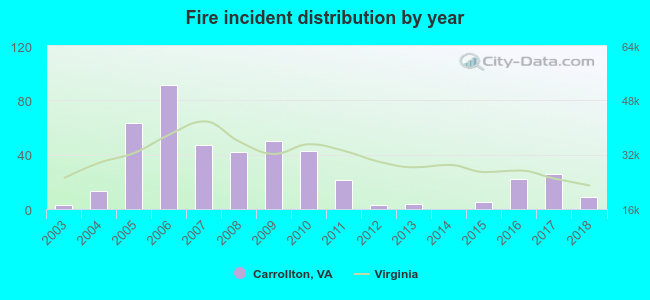 According to the data from the years 2003 - 2018 the average number of fires per year is 28. The highest number of reported fire incidents - 91 took place in 2006, and the least - 0 in 2014. The data has a growing trend.
 29.1% incidents where reported in the morning and 70.9% in the evening. The most fires (17.6%) took place on Saturday, and the least (13.1%) on Tuesday.
 According to the 443 fire incident reports from years 2003 - 2018 most fires (13.8%) took place during March, and the least (5.0%) in February.
 Out of all 3,117 cases reported during the years 2003 - 2018, the most belonged to the categories: Rescue & EMS (69.7%), Fire (14.2%), and Hazardous Condition (5.1%).
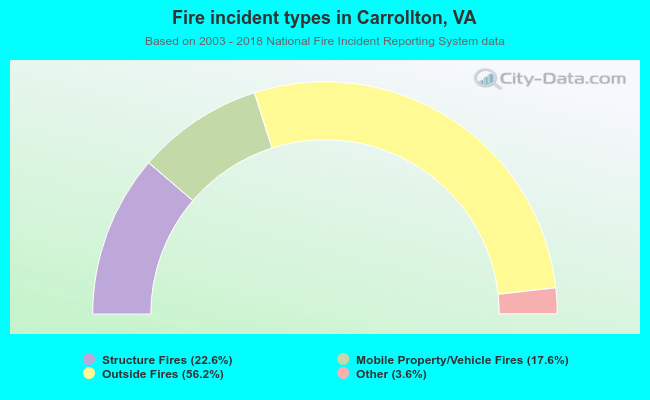 When looking into fire subcategories, the most incidents belonged to: Outside Fires (56.2%), and Structure Fires (22.6%).