Carrollton: Fire Incidents, Illinois (IL)
Where are fire incidents reported in Carrollton, IL
Something went wrong! Please refresh the page.
|
| |||||||||||||||||||||||||||||||||||||||||||||||||||||||||||||||||||||||||||||||||||||||||||||||||||||||||||||
| Other | 40 | |||||||||||||||||||||||||||||||||||||||||||||||||||||||||||||||||||||||||||||||||||||||||||||||||||||||||||||
2002 - 2018 National Fire Incident Reporting System (NFIRS) incidents
- Incident types reported to NFIRS in Carrollton, IL
- 19643.8%Fire
- 11124.8%Hazardous Condition
- 10523.4%Rescue & EMS
- 153.3%Good Intent Call
- 132.9%Service Call
- 61.3%False Alarm
- 10.2%Overpressure Rupture
- 10.2%Severe Weather
- Fire incident types reported to NFIRS in Carrollton, IL
- 7839.8%Outside Fires
- 6935.2%Structure Fires
- 4623.5%Mobile Property/Vehicle Fires
- 31.5%Other
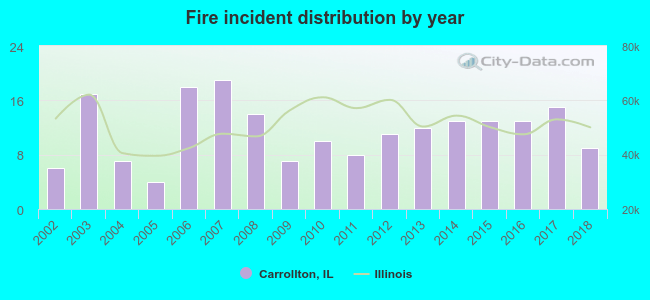 According to the data from the years 2002 - 2018 the average number of fires per year is 12. The highest number of reported fires - 19 took place in 2007, and the least - 4 in 2005. The data has a growing trend.
 23.5% incidents where reported in the morning and 76.5% in the evening. The most fires (20.4%) took place on Saturday, and the least (9.7%) on Monday.
 According to the 196 fire incidents from years 2002 - 2018 most fires (12.8%) took place during January, and the least (3.6%) in December.
 Out of all 448 cases reported during the years 2002 - 2018, the most belonged to the categories: Fire (43.8%), Hazardous Condition (24.8%), and Rescue & EMS (23.4%).
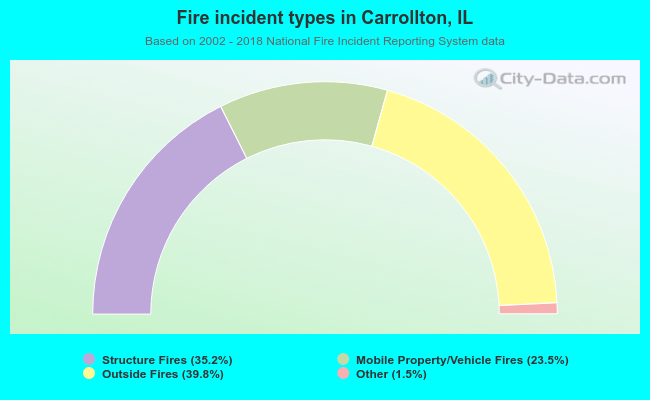 When looking into fire subcategories, the most incidents belonged to: Outside Fires (39.8%), and Structure Fires (35.2%).