| Fire incidents reported |
|---|
| Sreet name | Count |
|---|
| CEYLON ROAD | 12 | | ROY E FURMAN HIGHWAY HWY | 10 | | RTE EIGHTY EIGHT HWY | 10 | | CARMICHAELS RD RD | 8 | | CEYLON RD | 8 | | PARKVIEW KNOLL | 8 | | STRING TOWN RD | 8 | | GREENE ST | 6 | | JENSON HOLLOW RD | 6 | | MARKET ST | 6 | | RTE EIGHTY EIGHT RD | 6 | | SOUTH BRANCH ROAD RD | 6 | | ULLERY RD | 6 | | VINE ST | 6 | | CEDARWOOD MNR | 4 | | CRUCIBLE ROAD | 4 | | GEORGE ST | 4 | | HART RD | 4 | | JACOBS FERRY RD | 4 | | KURANS RD RD | 4 | | LITTLE CHICAGO RD | 4 | | STEVENSON LA | 4 | | VINE ST. | 4 | | BROWNSFERRY RD | 2 | | CARMICHAELS RD | 2 |
| | | Fire incidents reported |
|---|
| Sreet name | Count |
|---|
| CARTER ROAD | 2 | | CEDARWOOD APT. | 2 | | CREEK ROAD | 2 | | CREES ROAD RD | 2 | | CRUCIBLE RD | 2 | | CUMBERLAND VILLAGE | 2 | | DECKER RD | 2 | | DOWLIN AVE | 2 | | GEORGE | 2 | | GLADES RUN RD | 2 | | HATFIELD POWER PLANT RD | 2 | | HATFIELD POWER STATION | 2 | | JACKSON LN | 2 | | LIVE EASY RD | 2 | | MAPLE ST | 2 | | MARKET ST | 2 | | NEMACOLIN ROAD RD | 2 | | NEMACOLIN WAY | 2 | | NEMACOLIN WAY | 2 | | OLD TOWN RD | 2 | | PINE ST | 2 | | ROY E FURMAN HWY | 2 | | RT 21 MASONTOWN BRIDGE RD | 2 | | RTE 21 MHP | 2 | | |
|
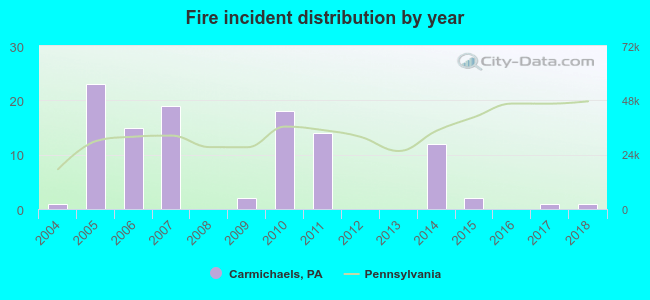 Based on the data from the years 2004 - 2018 the average number of fire incidents per year is 7. The highest number of reported fire incidents - 23 took place in 2005, and the least - 0 in 2008. The data has a constant trend.
 29.6% incidents where reported in the morning and 70.4% in the evening. The most fires (17.6%) took place on Thursday, and the least (10.2%) on Tuesday.
 Based on the 108 incident reports from years 2004 - 2018 most fires (13.0%) took place during April, and the least (2.8%) in October.
 Out of all 326 cases reported during the years 2004 - 2018, the most belonged to the categories: Fire (33.1%), Hazardous Condition (29.4%), and Rescue & EMS (20.6%).
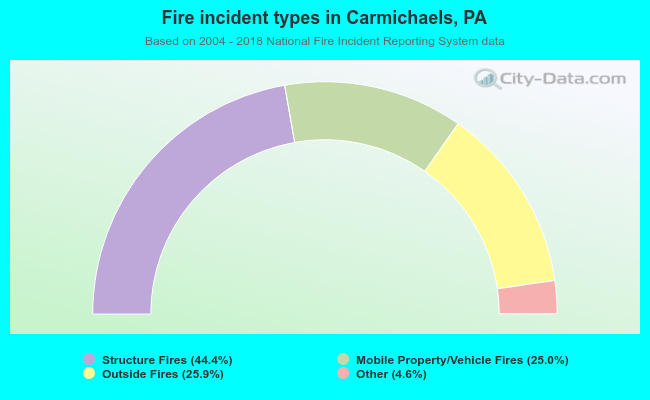 When looking into fire subcategories, the most reports belonged to: Structure Fires (44.4%), and Outside Fires (25.9%).