Carlinville: Fire Incidents, Illinois (IL)
Where are fire incidents reported in Carlinville, IL
Something went wrong! Please refresh the page.
|
| |||||||||||||||||||||||||||||||||||||||||||||||||||||||||||||||||||||||||||||||||||||||||||||||||||||||||||||
2006 - 2018 National Fire Incident Reporting System (NFIRS) incidents
- Incident types reported to NFIRS in Carlinville, IL
- 38838.7%Fire
- 20520.4%False Alarm
- 19219.1%Rescue & EMS
- 12112.1%Hazardous Condition
- 696.9%Good Intent Call
- 141.4%Severe Weather
- 131.3%Service Call
- Fire incident types reported to NFIRS in Carlinville, IL
- 15941.0%Structure Fires
- 14737.9%Outside Fires
- 5614.4%Mobile Property/Vehicle Fires
- 266.7%Other
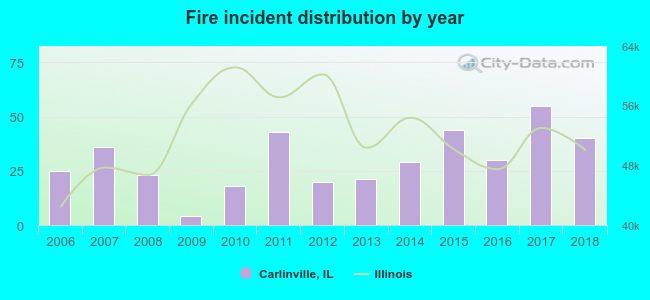 Based on the data from the years 2006 - 2018 the average number of fires per year is 30. The highest number of fire incidents - 55 took place in 2017, and the least - 4 in 2009. The data has a rising trend.
The average number of yearly fire incidents per 10k residents in Carlinville, IL compared to nearest cities:
(Note: Based on data for the last 3 years, including only cities with population 5,000 and above)
| Carlinville: | 72.4 |
| Litchfield: | 71.2 |
| Staunton: | 45.5 |
| Hillsboro: | 26.8 |
| Jerseyville: | 34.0 |
| Bethalto: | 16.0 |
| Chatham: | 34.4 |
| Godfrey: | 39.2 |
| East Alton: | 107.8 |

 28.9% incidents where reported in the morning and 71.1% in the evening. The most fires (19.6%) took place on Saturday, and the least (12.4%) on Thursday.
 Based on the 388 reports from years 2006 - 2018 most fires (13.7%) took place during September, and the least (3.6%) in June.
 Out of all 1,003 cases reported during the years 2006 - 2018, the most belonged to the categories: Fire (38.7%), False Alarm (20.4%), and Rescue & EMS (19.1%).
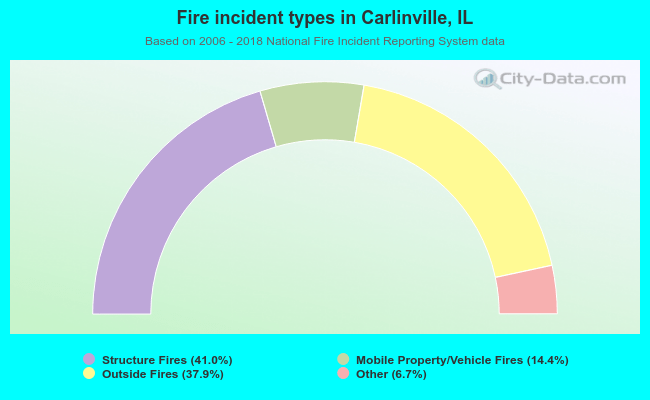 When looking into fire subcategories, the most incidents belonged to: Structure Fires (41.0%), and Outside Fires (37.9%).