Captiva: Fire Incidents, Florida (FL)
Where are fire incidents reported in Captiva, FL
Something went wrong! Please refresh the page.
|
| |||||||||||||||||||||||||||||||||||||||||||||||||||||||||||||
2002 - 2018 National Fire Incident Reporting System (NFIRS) incidents
- Incident types reported to NFIRS in Captiva, FL
- 1,10748.6%Rescue & EMS
- 36015.8%Good Intent Call
- 28112.3%False Alarm
- 2109.2%Hazardous Condition
- 1637.1%Service Call
- 1486.5%Fire
- 100.4%Special Incident
- Fire incident types reported to NFIRS in Captiva, FL
- 7248.6%Outside Fires
- 5537.2%Structure Fires
- 117.4%Other
- 106.8%Mobile Property/Vehicle Fires
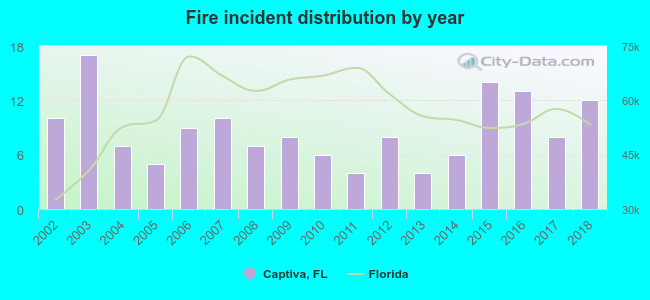 According to the data from the years 2002 - 2018 the average number of fire incidents per year is 9. The highest number of fire incidents - 17 took place in 2003, and the least - 4 in 2011. The data has an increasing trend.
 29.7% incidents where reported in the morning and 70.3% in the evening. The most fires (18.9%) took place on Saturday, and the least (8.1%) on Thursday.
 According to the 148 fires from years 2002 - 2018 most fires (12.8%) took place during February, and the least (3.4%) in September.
 Out of all 2,280 cases reported during the years 2002 - 2018, the most belonged to the categories: Overpressure Rupture (48.6%), Service Call (15.8%), and Good Intent Call (12.3%).
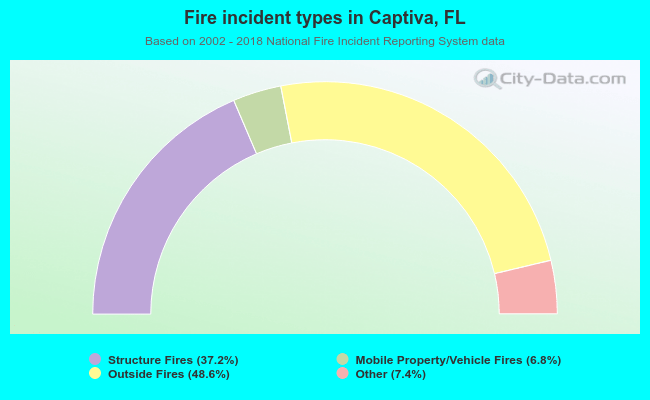 When looking into fire subcategories, the most reports belonged to: Outside Fires (48.6%), and Structure Fires (37.2%).