| Fire incidents reported |
|---|
| Sreet name | Count |
|---|
| MARLBORO PIKE EB | 10 | | MARLBORO PIKE WB | 8 | | SOUTHERN AVE | 8 | | ADDISON RD | 6 | | CENTRAL AVE WB | 6 | | EASTERN AVE | 6 | | HAMPTON PARK BLVD | 6 | | RONALD RD | 6 | | TUNIC AVE | 6 | | WALKER MILL RD SB | 6 | | 58TH AVE | 4 | | BROOKS DR SB | 4 | | CEDARLEAF AVE | 4 | | CENTRAL AVE EB | 4 | | CENTRAL AVE EB HAMPTON PARK | 4 | | CROWN ST | 4 | | CYPRESSTREE DR | 4 | | FALKLAND PL | 4 | | FARMINGDALE AVE | 4 | | KAYAK AVE | 4 | | MARLBORO PIKE EB BOONES HILL | 4 | | MARTIN LUTHER KING JUNIOR HWY | 4 | | MOUNTAIN LAKE PL | 4 | | OPUS AVE | 4 | | POSSUM CT | 4 |
| | | Fire incidents reported |
|---|
| Sreet name | Count |
|---|
| RITCHIE STATION CT | 4 | | SHADY GLEN DR | 4 | | SHADY GLEN TER | 4 | | SUFFOLK AVE | 4 | | 495RITCHIE MARLBORO RD | 2 | | 59TH AVE | 2 | | 59TH AVE L ST | 2 | | ABEL AVE | 2 | | ABEL AVE FABLE ST | 2 | | ADDISON RD CENTRAL AVE WB | 2 | | ADDISON RD FARMINGDALE AVE | 2 | | ADDISON RD S RONALD RD | 2 | | AKIN AVE | 2 | | ALAKING CT | 2 | | ARENAS CT FUNDERBURG DR | 2 | | BEAVER HEIGHTS LN | 2 | | BENNING RD | 2 | | BLK RITCHIE STATION CT | 2 | | BOONES HILL RD | 2 | | CALDER DR | 2 | | CAPITOL HEIGHTS BLVD EMMET S AVE | 2 | | CENTRAL AVE | 2 | | CENTRAL AVE SOUTHERN AVE | 2 | | CHANCE PL | 2 | | |
|
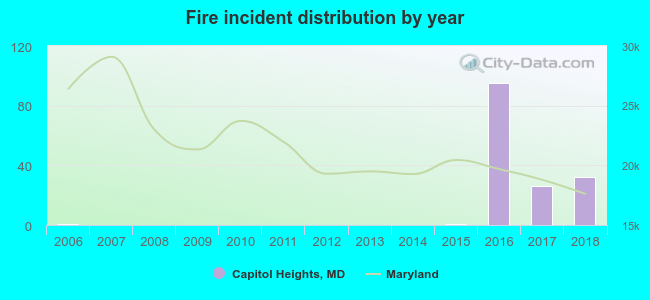 According to the data from the years 2006 - 2018 the average number of fires per year is 12. The highest number of fire incidents - 95 took place in 2016, and the least - 0 in 2007. The data has an increasing trend.
 31.6% incidents where reported in the morning and 68.4% in the evening. The most fires (22.6%) took place on Sunday, and the least (9.0%) on Tuesday.
 According to the 155 fire incident reports from years 2006 - 2018 most fires (11.6%) took place during April, and the least (5.2%) in September.
 Out of all 8,742 cases reported during the years 2006 - 2018, the most belonged to the categories: Rescue & EMS (85.3%), False Alarm (5.5%), and Service Call (2.6%).
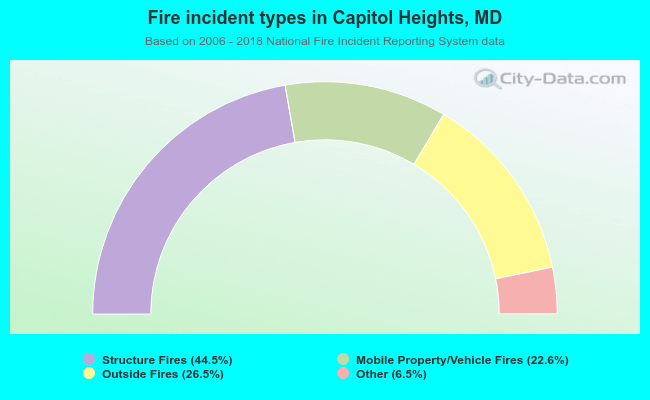 When looking into fire subcategories, the most incidents belonged to: Structure Fires (44.5%), and Outside Fires (26.5%).