| Fire incidents reported |
|---|
| Sreet name | Count |
|---|
| BAYSHORE DR | 22 | | STAR HILL DR | 16 | | YAUPON DR | 14 | | HWY 58 | 12 | | WB MCLEAN DR | 12 | | BAHIA LN | 10 | | EASY ST | 10 | | QUAILWOOD CT | 10 | | VFW RD | 10 | | W B MCLEAN DR | 10 | | 58 HWY | 8 | | HWY 24 | 8 | | MANATEE ST | 8 | | QUAILWOOD CIR | 8 | | ANITA FORTE DR | 6 | | B MCLEAN DR | 6 | | BONITA ST | 6 | | TAYLOR NOTION RD | 6 | | W B MCLEAN BLVD | 6 | | APOLLO CT | 4 | | APOLLO DR | 4 | | CAPE POINT CT | 4 | | CEDAR POINT BLVD | 4 | | GOLPHIN DOLPHIN DR | 4 | | HIDDEN BAY DR | 4 |
| | | Fire incidents reported |
|---|
| Sreet name | Count |
|---|
| HUNTER BROWN DR | 4 | | OCEAN SPRAY DR | 4 | | PETTIFORD RD | 4 | | PINE LAKE RD | 4 | | QUAILWOOD CT | 4 | | SUTTON DR | 4 | | TIFTON CIR | 4 | | 101 W.B MCLEAN DR. | 2 | | 122 SILVER CREEK LANDING | 2 | | 312 VFW ROAD | 2 | | 321 W.B. MCLEAN DRIVE | 2 | | 5252 HWY 24 | 2 | | 555 W.B. MCLEAN DR | 2 | | 968 HI-WAY 58 | 2 | | AMPITHEATRE DR | 2 | | ANITA FORTE | 2 | | ANITA FORTE DRIVE | 2 | | ARDAN OAKS DR | 2 | | ARDEN OAK DR | 2 | | ARDEN OAKS DR | 2 | | ASH STREET | 2 | | AZALEA CT | 2 | | BAHIA LANE | 2 | | BOB WHITE CIR | 2 | | |
|
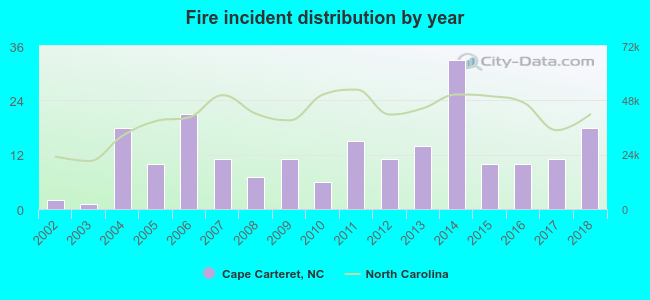 According to the data from the years 2002 - 2018 the average number of fires per year is 12. The highest number of fires - 33 took place in 2014, and the least - 1 in 2003. The data has an increasing trend.
 34.9% incidents where reported in the morning and 65.1% in the evening. The most fires (18.2%) took place on Sunday, and the least (11.5%) on Friday.
 Based on the 209 incident reports from years 2002 - 2018 most fires (16.3%) took place during April, and the least (3.3%) in November.
 Out of all 1,645 cases reported during the years 2002 - 2018, the most belonged to the categories: Overpressure Rupture (58.5%), Fire (12.7%), and Service Call (11.0%).
 When looking into fire subcategories, the most reports belonged to: Structure Fires (56.9%), and Outside Fires (29.2%).