Capac: Fire Incidents, Michigan (MI)
Where are fire incidents reported in Capac, MI
Something went wrong! Please refresh the page.
|
| |||||||||||||||||||||||||||||||||||||||||||||||||||||||||||||||||||||||||||||||||||||||||||||||||||||||||||||
2002 - 2018 National Fire Incident Reporting System (NFIRS) incidents
- Incident types reported to NFIRS in Capac, MI
- 30538.6%Rescue & EMS
- 22929.0%Fire
- 13116.6%Hazardous Condition
- 415.2%False Alarm
- 354.4%Good Intent Call
- 334.2%Service Call
- 70.9%Severe Weather
- 60.8%Special Incident
- 30.4%Overpressure Rupture
- Fire incident types reported to NFIRS in Capac, MI
- 12253.3%Structure Fires
- 6427.9%Outside Fires
- 2611.4%Mobile Property/Vehicle Fires
- 177.4%Other
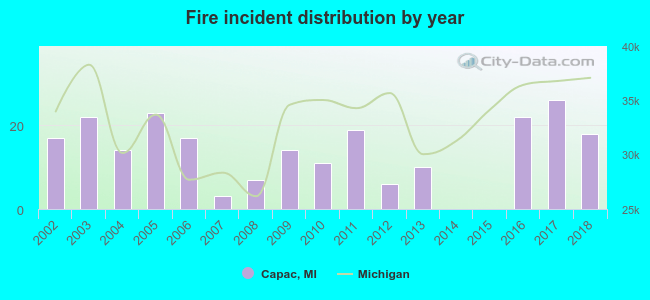 Based on the data from the years 2002 - 2018 the average number of fire incidents per year is 13. The highest number of reported fire incidents - 26 took place in 2017, and the least - 0 in 2014. The data has an increasing trend.
 36.2% incidents where reported in the morning and 63.8% in the evening. The most fires (19.2%) took place on Friday, and the least (10.5%) on Tuesday.
 According to the 229 reports from years 2002 - 2018 most fires (12.2%) took place during September, and the least (5.7%) in November.
 Out of all 790 cases reported during the years 2002 - 2018, the most belonged to the categories: Rescue & EMS (38.6%), Fire (29.0%), and Hazardous Condition (16.6%).
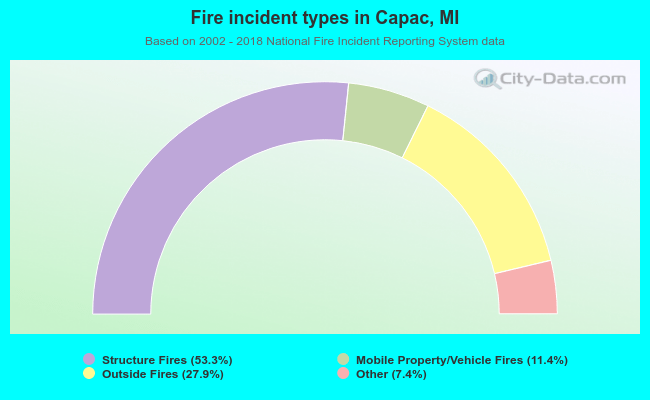 When looking into fire subcategories, the most reports belonged to: Structure Fires (53.3%), and Outside Fires (27.9%).