Cannon Beach: Fire Incidents, Oregon (OR)
Where are fire incidents reported in Cannon Beach, OR
Something went wrong! Please refresh the page.
|
| |||||||||||||||||||||||||||||||||||||||||||||||||||||||||||||||||||||||||||||||||||||||||||||||||||||||||||||
2002 - 2018 National Fire Incident Reporting System (NFIRS) incidents
- Incident types reported to NFIRS in Cannon Beach, OR
- 26744.6%Rescue & EMS
- 13522.5%Fire
- 579.5%False Alarm
- 477.8%Hazardous Condition
- 447.3%Good Intent Call
- 325.3%Service Call
- 132.2%Severe Weather
- 30.5%Special Incident
- 10.2%Overpressure Rupture
- Fire incident types reported to NFIRS in Cannon Beach, OR
- 8059.3%Structure Fires
- 2820.7%Outside Fires
- 1712.6%Mobile Property/Vehicle Fires
- 107.4%Other
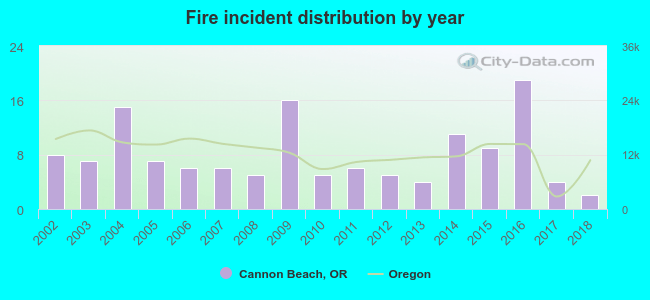 According to the data from the years 2002 - 2018 the average number of fire incidents per year is 8. The highest number of reported fires - 19 took place in 2016, and the least - 2 in 2018. The data has a decreasing trend.
 32.6% incidents where reported in the morning and 67.4% in the evening. The most fires (17.8%) took place on Thursday, and the least (11.1%) on Friday.
 Based on the 135 reports from years 2002 - 2018 most fires (14.1%) took place during August, and the least (3.0%) in April.
 Out of all 599 cases reported during the years 2002 - 2018, the most belonged to the categories: Rescue & EMS (44.6%), Fire (22.5%), and False Alarm (9.5%).
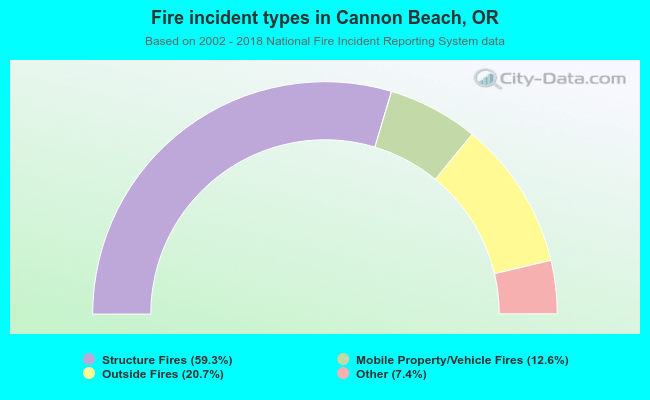 When looking into fire subcategories, the most incidents belonged to: Structure Fires (59.3%), and Outside Fires (20.7%).