Canfield: Fire Incidents, Ohio (OH)
Where are fire incidents reported in Canfield, OH
Something went wrong! Please refresh the page.
| Fire incidents reported | |
|---|---|
| Sreet name | Count |
| MAIN ST | 110 |
| WESTERN RESERVE RD | 80 |
| RACCOON RD | 56 |
| PALMYRA RD | 50 |
| W CALLA RD | 44 |
| HERBERT RD | 32 |
| GIBSON RD | 28 |
| LEFFINGWELL RD | 26 |
| ROUTE 62 | 26 |
| BROAD ST | 18 |
| CANFIELD RD | 18 |
| COLUMBIANA-CANFIELD RD | 18 |
| LISBON ST | 18 |
| RACCOON | 18 |
| CARDINAL DR | 16 |
| COL-CANF RD | 14 |
| DETWILER RD | 14 |
| FAIRGROUND BLVD | 14 |
| LEFFINGWELL RD | 14 |
| W MIDDLETOWN RD | 14 |
| AKRON CANFIELD RD | 12 |
| BURGETT RD | 12 |
| CALLA RD | 12 |
| COLUMBIANACANFIELD RD | 12 |
| INDIAN RUN DR | 12 |
| KIRK RD | 12 |
| MAIN | 12 |
| MIDDLETOWN RD | 12 |
| PALMYRA | 12 |
| TIPPECANOE RD | 12 |
| Other | 253 |
2002 - 2018 National Fire Incident Reporting System (NFIRS) incidents
- Incident types reported to NFIRS in Canfield, OH
- 4,29444.6%Rescue & EMS
- 1,86019.3%Hazardous Condition
- 1,42614.8%Service Call
- 1,00110.4%Fire
- 5926.1%False Alarm
- 3914.1%Good Intent Call
- 380.4%Severe Weather
- 200.2%Overpressure Rupture
- 120.1%Special Incident
- Fire incident types reported to NFIRS in Canfield, OH
- 50850.7%Structure Fires
- 32432.4%Outside Fires
- 15515.5%Mobile Property/Vehicle Fires
- 141.4%Other
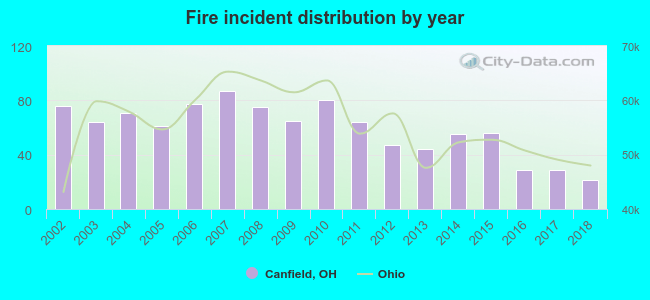 Based on the data from the years 2002 - 2018 the average number of fire incidents per year is 59. The highest number of fires - 87 took place in 2007, and the least - 21 in 2018. The data has a declining trend.
The average number of yearly fire incidents per 10k residents in Canfield, OH compared to nearest cities:
(Note: Based on data for the last 3 years, including only cities with population 5,000 and above)
| Canfield: | 35.6 |
| Austintown: | 36.3 |
| Boardman: | 20.4 |
| Youngstown: | 89.8 |
| Struthers: | 33.2 |
| Girard: | 36.9 |
| Campbell: | 88.4 |
| Salem: | 86.3 |
| Columbiana: | 40.0 |
 The median response time based on all reported fire incidents is 6 minutes. This is about the same as the state median value.
The median response time in Canfield, OH compared to nearest cities:
(Note: Based on data for all years, including only cities with at least 500 fire incidents)
| Canfield: | 6 minutes |
| Austintown: | 5 minutes |
| Boardman: | 4 minutes |
| Youngstown: | 3 minutes |
| Struthers: | 3 minutes |
| Girard: | 4 minutes |
| Campbell: | 3 minutes |
| Salem: | 7 minutes |
| Niles: | 4 minutes |
 According to the data from the years 2002 - 2018 the average number of fire-related casualties per year is 2. The highest number of reported casualties - 7 took place in 2010, and the lowest - 0 in 2002. The data has a constant trend.
The average number of injuries per 1,000 fire incidents is 34. This indicator was the highest - 94 in 2003, and the lowest 0 in 2002. The trend for casualties per 1,000 fires is constant. Compared to the Ohio value the number of casualties per 1,000 incidents is much higher.
According to the data from the years 2002 - 2018 the average number of fire-related casualties per year is 2. The highest number of reported casualties - 7 took place in 2010, and the lowest - 0 in 2002. The data has a constant trend.
The average number of injuries per 1,000 fire incidents is 34. This indicator was the highest - 94 in 2003, and the lowest 0 in 2002. The trend for casualties per 1,000 fires is constant. Compared to the Ohio value the number of casualties per 1,000 incidents is much higher.Casualties per 1,000 incidents in Canfield, OH compared to nearest cities:
(Note: Based on data for all years, including only cities with at least 500 fire incidents)
| Canfield: | 38.0 |
| Austintown: | 40.8 |
| Boardman: | 52.1 |
| Youngstown: | 11.1 |
| Struthers: | 21.8 |
| Girard: | 5.8 |
| Campbell: | 11.4 |
| Salem: | 3.3 |
| Niles: | 17.0 |
 30.9% incidents where reported in the morning and 69.1% in the evening. The most fires (17.1%) took place on Monday, and the least (12.2%) on Sunday.
 Based on the 1,001 reports from years 2002 - 2018 most fires (10.9%) took place during April, and the least (5.2%) in February.
 Out of all 9,634 cases reported during the years 2002 - 2018, the most belonged to the categories: Rescue & EMS (44.6%), Hazardous Condition (19.3%), and Service Call (14.8%).
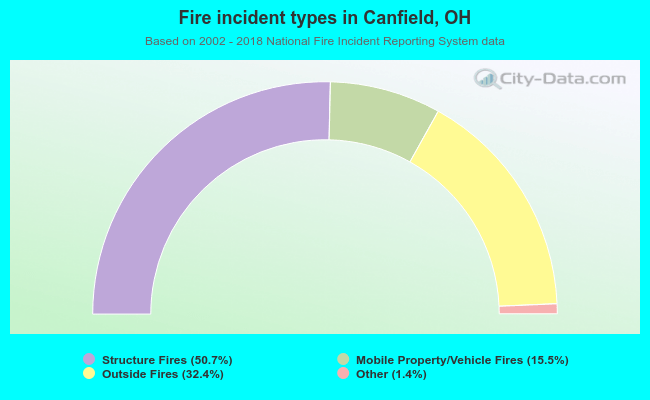 When looking into fire subcategories, the most reports belonged to: Structure Fires (50.7%), and Outside Fires (32.4%).