Cameron Park: Fire Incidents, California (CA)
Where are fire incidents reported in Cameron Park, CA
Something went wrong! Please refresh the page.
|
| |||||||||||||||||||||||||||||||||||||||||||||||||||||||||||||||||||||||||||||||||||||||||||||||||||||||||||||
2005 - 2018 National Fire Incident Reporting System (NFIRS) incidents
- Incident types reported to NFIRS in Cameron Park, CA
- 2,48167.3%Rescue & EMS
- 44212.0%Good Intent Call
- 3659.9%Fire
- 2797.6%Service Call
- 671.8%False Alarm
- 441.2%Hazardous Condition
- 40.1%Special Incident
- Fire incident types reported to NFIRS in Cameron Park, CA
- 22260.8%Structure Fires
- 9826.8%Outside Fires
- 297.9%Mobile Property/Vehicle Fires
- 164.4%Other
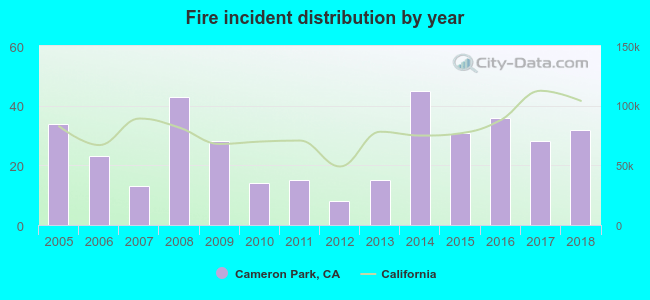 Based on the data from the years 2005 - 2018 the average number of fire incidents per year is 26. The highest number of reported fire incidents - 45 took place in 2014, and the least - 8 in 2012. The data has a declining trend.
The average number of yearly fire incidents per 10k residents in Cameron Park, CA compared to nearest cities:
(Note: Based on data for the last 3 years, including only cities with population 5,000 and above)
| Cameron Park: | 17.6 |
| El Dorado Hills: | 24.3 |
| Diamond Springs: | 11.8 |
| Folsom: | 7.3 |
| Placerville: | 119.4 |
| Granite Bay: | 28.4 |
| Orangevale: | 13.5 |
| Rancho Murieta: | 34.6 |
| Sloughhouse: | 25.9 |

 29.3% incidents where reported in the morning and 70.7% in the evening. The most fires (17.3%) took place on Friday, and the least (12.1%) on Monday.
 Based on the 365 fire incidents from years 2005 - 2018 most fires (14.5%) took place during August, and the least (4.4%) in April.
 Out of all 3,685 cases reported during the years 2005 - 2018, the most belonged to the categories: Rescue & EMS (67.3%), Good Intent Call (12.0%), and Fire (9.9%).
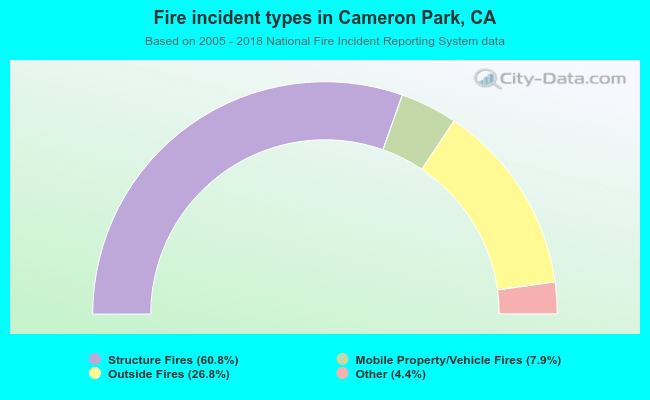 When looking into fire subcategories, the most reports belonged to: Structure Fires (60.8%), and Outside Fires (26.8%).