| Fire incidents reported |
|---|
| Sreet name | Count |
|---|
| CAMDEN RD | 24 | | TERRITORIAL RD | 20 | | MONTGOMERY RD | 16 | | WOODBRIDGE RD | 16 | | AUSTIN RD | 14 | | HILLSDALE RD | 14 | | DIMMERS RD | 10 | | BURT RD | 8 | | FRONTIER RD | 8 | | PIONEER RD | 8 | | SAMPSON RD | 8 | | WOODARD RD | 8 | | 8711 AUSTIN RD | 6 | | EDON RD | 6 | | GRANT RD | 6 | | PATRICK RD | 6 | | ABBOTT RD | 4 | | AUSTIN RD | 4 | | CAMDEN RD | 4 | | CAMDEN ROAD | 4 | | CARPENTER RD | 4 | | CELLARS RD | 4 | | CRAMPTON RD | 4 | | GRASS LAKE RD | 4 | | M-49 | 4 |
| | | Fire incidents reported |
|---|
| Sreet name | Count |
|---|
| M99 HWY | 4 | | MAIN ST | 4 | | MAIN ST | 4 | | MAPLE ST | 4 | | MEAD RD | 4 | | SAMPSON | 4 | | TERRITORIAL ROAD | 4 | | WOODBRIDGE RD | 4 | | 100 N MAIN | 2 | | 1000 EAST | 2 | | 1000 EAST MICHIGAN RD | 2 | | 105 MILLER ST | 2 | | 10800 GRANT RD | 2 | | 11031 CAMBRIA RD | 2 | | 11500 GILMORE RD | 2 | | 116 W MAPLE ST | 2 | | 11667 GILMORE RD | 2 | | 120 MAPLE ST | 2 | | 121 JASPER ST | 2 | | 12171 FRONTIER RD | 2 | | 12640 WOODBRIDGE RD | 2 | | 12720 BISHOP RD | 2 | | 12862 S HILLSDALE RD | 2 | | 129 DWIGHT ST | 2 | | |
|
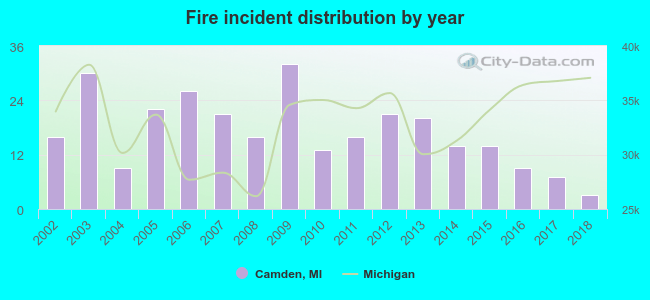 According to the data from the years 2002 - 2018 the average number of fires per year is 17. The highest number of reported fire incidents - 32 took place in 2009, and the least - 3 in 2018. The data has a dropping trend.
 26.3% incidents where reported in the morning and 73.7% in the evening. The most fires (16.6%) took place on Monday, and the least (11.1%) on Wednesday.
 According to the 289 fire incident reports from years 2002 - 2018 most fires (21.1%) took place during April, and the least (4.2%) in December.
 Out of all 661 cases reported during the years 2002 - 2018, the most belonged to the categories: Fire (43.7%), Overpressure Rupture (33.4%), and Rescue & EMS (14.4%).
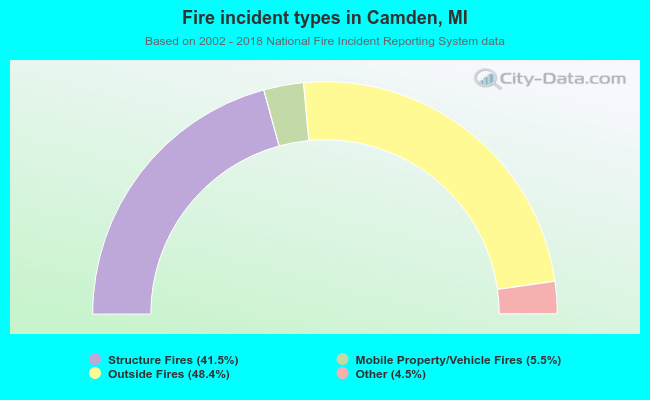 When looking into fire subcategories, the most reports belonged to: Outside Fires (48.4%), and Structure Fires (41.5%).