Camden: Fire Incidents, Indiana (IN)
Where are fire incidents reported in Camden, IN
Something went wrong! Please refresh the page.
|
| |||||||||||||||||||||||||||||||||||||||||||||||||||||||||||||||||||||||||||||||||||||||||||||||||||||||||||||
2003 - 2016 National Fire Incident Reporting System (NFIRS) incidents
- Incident types reported to NFIRS in Camden, IN
- 16938.5%Fire
- 13129.8%Rescue & EMS
- 4710.7%Special Incident
- 398.9%Hazardous Condition
- 214.8%False Alarm
- 194.3%Service Call
- 92.1%Good Intent Call
- 40.9%Severe Weather
- Fire incident types reported to NFIRS in Camden, IN
- 8248.5%Structure Fires
- 5934.9%Outside Fires
- 1710.1%Mobile Property/Vehicle Fires
- 116.5%Other
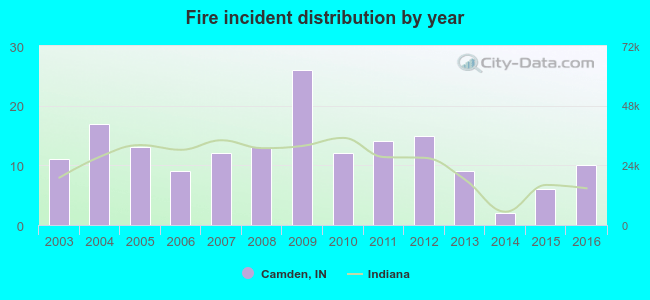 According to the data from the years 2003 - 2016 the average number of fire incidents per year is 12. The highest number of fire incidents - 26 took place in 2009, and the least - 2 in 2014. The data has a declining trend.
 Based on the data from the years 2003 - 2016 the average number of fire-related casualties per year is 0. The highest number of reported casualties - 2 took place in 2005, and the lowest - 0 in 2003. The data has a constant trend.
 34.9% incidents where reported in the morning and 65.1% in the evening. The most fires (18.3%) took place on Friday, and the least (9.5%) on Tuesday.
 According to the 169 fires from years 2003 - 2016 most fires (12.4%) took place during March, and the least (3.0%) in August.
 Out of all 439 cases reported during the years 2003 - 2016, the most belonged to the categories: Fire (38.5%), Overpressure Rupture (29.8%), and Severe Weather (10.7%).
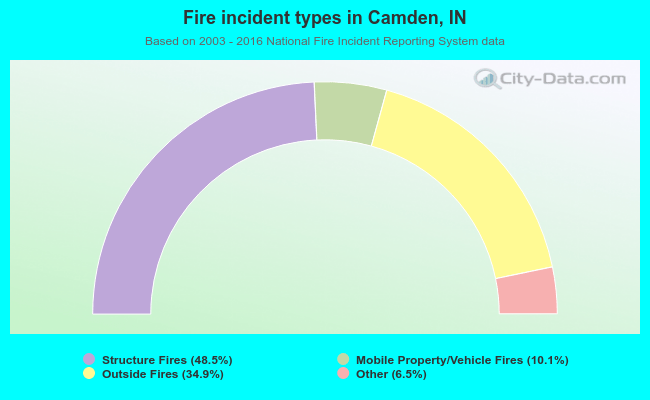 When looking into fire subcategories, the most incidents belonged to: Structure Fires (48.5%), and Outside Fires (34.9%).