| Fire incidents reported |
|---|
| Sreet name | Count |
|---|
| MARIETTA RD | 14 | | I 77 | 12 | | MCCONNELSVILLE RD | 12 | | HY 77 | 10 | | MARIETTA ROAD | 10 | | FROSTYVILLE RD | 8 | | HALLEY RIDGE RD. | 8 | | HALLEYS RIDGE RD | 6 | | RALPH RD | 6 | | SPRUCE ST | 6 | | 20174 SALT RUN ROAD | 4 | | 45198 CORNSTALK RD | 4 | | ADA AVE | 4 | | COBB RD. | 4 | | CORN STALK ROAD | 4 | | FAIRGROUND RD | 4 | | FAIRGROUND RD LGTS | 4 | | FROSTYVILLE RD | 4 | | GEORGE LAWRENCE RD | 4 | | HORN RIDGE ROAD | 4 | | HW 77 | 4 | | INTERSTATE 77 | 4 | | INTERSTATE 77 HWY | 4 | | MAIN ST | 4 | | MARIETTA RD. | 4 |
| | | Fire incidents reported |
|---|
| Sreet name | Count |
|---|
| MOORE STREET | 4 | | PERRY HOLLOW RD | 4 | | RADO RIDGE RD | 4 | | RALPH ROAD | 4 | | RICH VALLEY RD | 4 | | SALT RUN RD | 4 | | SHARON STONE RD | 4 | | SOUTH DUDLEY RD WEST | 4 | | SR 564 | 4 | | SR 78 | 4 | | STATE ROUTE 78 | 4 | | TWP 5 | 4 | | WOLF RUN DRIVE | 4 | | 1 LAKE VIEW | 2 | | 1005 FAIR GROUND STREET | 2 | | 1112 NORTH ST | 2 | | 117 MORNE ST | 2 | | 1217 NORTH ST | 2 | | 1314 NORTH ST | 2 | | 13287 MCCONESVILLE RD | 2 | | 14294 FOGLE RD | 2 | | 15113 MCONOSVILLE ROAD | 2 | | 15708 MCCONNELLSVILLE RD | 2 | | 15830 T RIDGE ROAD | 2 | | |
|
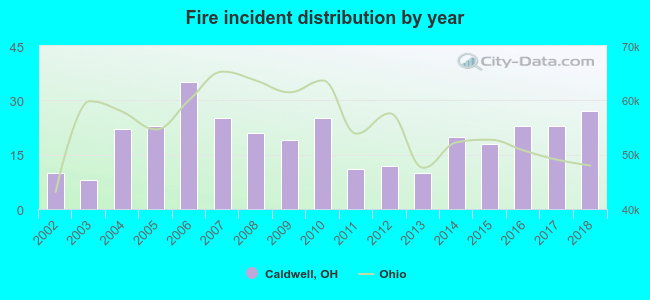 Based on the data from the years 2002 - 2018 the average number of fire incidents per year is 20. The highest number of reported fire incidents - 35 took place in 2006, and the least - 8 in 2003. The data has a growing trend.
 32.5% incidents where reported in the morning and 67.5% in the evening. The most fires (18.4%) took place on Saturday, and the least (11.4%) on Friday.
 According to the 332 fire incident reports from years 2002 - 2018 most fires (11.7%) took place during February, and the least (4.5%) in May.
 Out of all 873 cases reported during the years 2002 - 2018, the most belonged to the categories: Fire (38.0%), Good Intent Call (33.3%), and Rescue & EMS (17.3%).
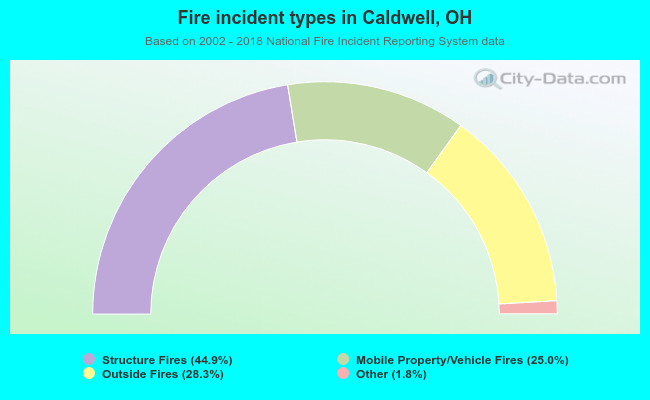 When looking into fire subcategories, the most incidents belonged to: Structure Fires (44.9%), and Outside Fires (28.3%).