Byron: Fire Incidents, Michigan (MI)
Where are fire incidents reported in Byron, MI
Something went wrong! Please refresh the page.
|
| |||||||||||||||||||||||||||||||||||||||||||||||||||||||||||||||||||||||||||||||||||||||||||||||||||||||||||||
2002 - 2018 National Fire Incident Reporting System (NFIRS) incidents
- Incident types reported to NFIRS in Byron, MI
- 39536.2%Fire
- 30928.3%Rescue & EMS
- 20819.1%Hazardous Condition
- 787.2%Service Call
- 534.9%Good Intent Call
- 211.9%False Alarm
- 121.1%Severe Weather
- 121.1%Special Incident
- 20.2%Overpressure Rupture
- Fire incident types reported to NFIRS in Byron, MI
- 24361.5%Structure Fires
- 11328.6%Outside Fires
- 297.3%Mobile Property/Vehicle Fires
- 102.5%Other
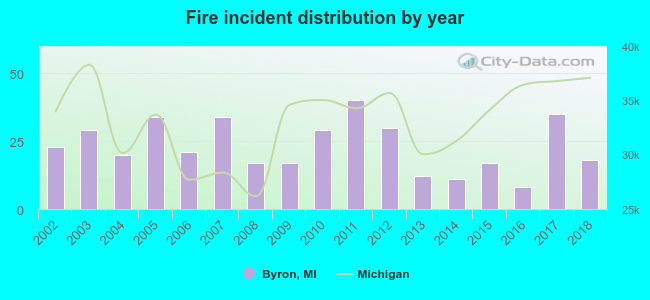 According to the data from the years 2002 - 2018 the average number of fires per year is 23. The highest number of reported fires - 40 took place in 2011, and the least - 8 in 2016. The data has a decreasing trend.
 27.6% incidents where reported in the morning and 72.4% in the evening. The most fires (17.2%) took place on Monday, and the least (12.9%) on Wednesday.
 According to the 395 reports from years 2002 - 2018 most fires (11.6%) took place during July, and the least (4.3%) in September.
 Out of all 1,090 cases reported during the years 2002 - 2018, the most belonged to the categories: Fire (36.2%), Rescue & EMS (28.3%), and Hazardous Condition (19.1%).
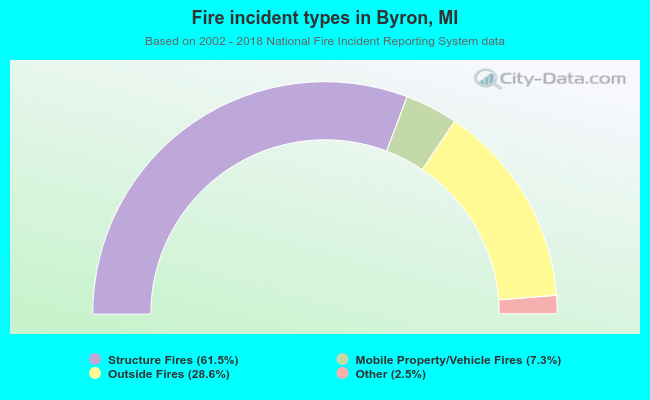 When looking into fire subcategories, the most incidents belonged to: Structure Fires (61.5%), and Outside Fires (28.6%).