Byron Center: Fire Incidents, Michigan (MI)
Where are fire incidents reported in Byron Center, MI
Something went wrong! Please refresh the page.
|
| |||||||||||||||||||||||||||||||||||||||||||||||||||||||||||||||||||||||||||||||||||||||||||||||||||||||||||||
2002 - 2018 National Fire Incident Reporting System (NFIRS) incidents
- Incident types reported to NFIRS in Byron Center, MI
- 3,83159.2%Rescue & EMS
- 73011.3%Fire
- 68510.6%Good Intent Call
- 4837.5%Hazardous Condition
- 3946.1%Service Call
- 3355.2%False Alarm
- 80.1%Severe Weather
- Fire incident types reported to NFIRS in Byron Center, MI
- 29240.0%Structure Fires
- 18725.6%Mobile Property/Vehicle Fires
- 16622.7%Outside Fires
- 8511.6%Other
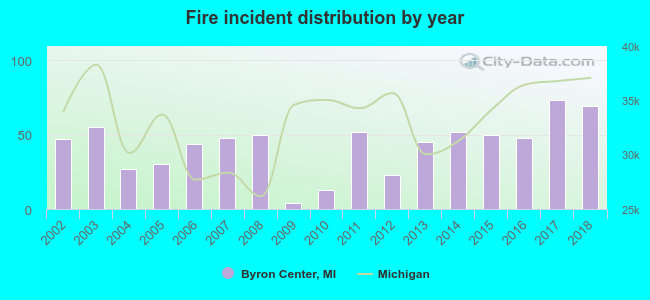 According to the data from the years 2002 - 2018 the average number of fires per year is 43. The highest number of reported fires - 73 took place in 2017, and the least - 4 in 2009. The data has an increasing trend.
The average number of yearly fire incidents per 10k residents in Byron Center, MI compared to nearest cities:
(Note: Based on data for the last 3 years, including only cities with population 5,000 and above)
| Byron Center: | 108.8 |
| Cutlerville: | 4.9 |
| Wyoming: | 27.7 |
| Grandville: | 32.4 |
| Kentwood: | 22.3 |
| Hudsonville: | 68.7 |
| Jenison: | 22.2 |
| Grand Rapids: | 42.6 |
| East Grand Rapids: | 6.8 |
 The median response time based on all reported fire incidents is 8 minutes. This is higher than the Michigan median value.
The median response time in Byron Center, MI compared to nearest cities:
(Note: Based on data for all years, including only cities with at least 500 fire incidents)
| Byron Center: | 8 minutes |
| Wyoming: | 6 minutes |
| Grandville: | 4 minutes |
| Kentwood: | 5 minutes |
| Hudsonville: | 6 minutes |
| Caledonia: | 8 minutes |
| Grand Rapids: | 5 minutes |
| Walker: | 9 minutes |
| Middleville: | 11 minutes |
 31.8% incidents where reported in the morning and 68.2% in the evening. The most fires (16.4%) took place on Friday, and the least (11.9%) on Sunday.
 Based on the 730 fire incidents from years 2002 - 2018 most fires (13.4%) took place during April, and the least (5.5%) in February.
 Out of all 6,475 cases reported during the years 2002 - 2018, the most belonged to the categories: Rescue & EMS (59.2%), Fire (11.3%), and Good Intent Call (10.6%).
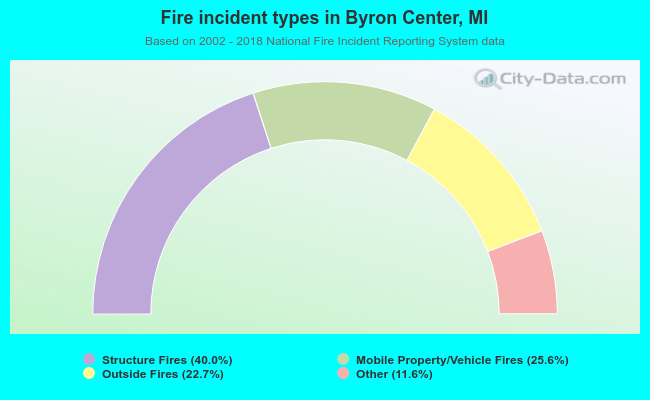 When looking into fire subcategories, the most reports belonged to: Structure Fires (40.0%), and Mobile Property/Vehicle Fires (25.6%).