| Fire incidents reported |
|---|
| Sreet name | Count |
|---|
| ALEXANDRIA (U.S. 27) PIKE | 10 | | 210 MATILDA ST | 8 | | FLOUR CREEK RD | 8 | | HWY 154 | 8 | | 17 HWY | 6 | | 332 OAK ST | 6 | | HWY 177 | 6 | | 10 HWY | 4 | | 210 MATILDA | 4 | | AA HWY | 4 | | BRYAN GRIFFIN RD | 4 | | GARVEY ROAD | 4 | | HWY 10 N | 4 | | HWY 27 N | 4 | | HWY 3149 | 4 | | HWY. 17 | 4 | | JACOBS RD | 4 | | LEHMAN DR | 4 | | MATILDA ST | 4 | | NAGEL RD | 4 | | S.R.177 HWY | 4 | | VATER RD | 4 | | 10089 HWY 17 N | 2 | | 102 MADISON ST | 2 | | 102 SOUTH ST | 2 |
| | | Fire incidents reported |
|---|
| Sreet name | Count |
|---|
| 104 MADISON ST | 2 | | 105 WILLIAMS ST | 2 | | 11 TAMMY LANE | 2 | | 110 CENTRAL | 2 | | 114 CENTRAL ST | 2 | | 1148 FLOUR CREEK RD | 2 | | 1169 BLACKBURN RD. | 2 | | 117 CENTRAL ST | 2 | | 1176 BRYANT-GRIFFIN RD | 2 | | 1219 FLOUR CREEK RD | 2 | | 13180 AA HWY | 2 | | 13392 HISSOM RD. | 2 | | 13652 AA HWY | 2 | | 14420 HWY 10 N | 2 | | 1500 LIGHTFOOT FORK RD | 2 | | 154 HWY | 2 | | 155 ASHWOOD RD | 2 | | 16749 HWY 8 | 2 | | 17065 HWY 10 N | 2 | | 1725 FLOUR CREEK RD | 2 | | 177 + MATILDA ST | 2 | | 177 HWY | 2 | | 201 MATILDA ST | 2 | | 205 MADISON ST | 2 | | |
|
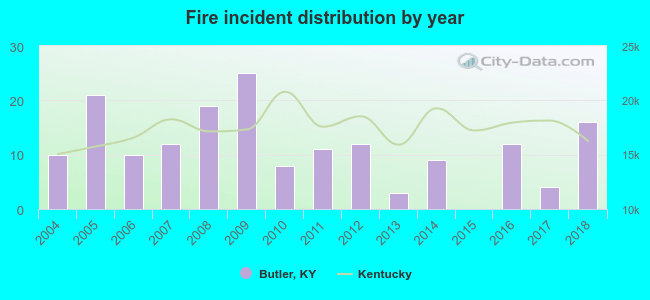 Based on the data from the years 2004 - 2018 the average number of fire incidents per year is 11. The highest number of fires - 25 took place in 2009, and the least - 0 in 2015. The data has an increasing trend.
 40.1% incidents where reported in the morning and 59.9% in the evening. The most fires (19.8%) took place on Saturday, and the least (10.5%) on Monday.
 Based on the 172 reports from years 2004 - 2018 most fires (12.2%) took place during October, and the least (5.8%) in April.
 Out of all 505 cases reported during the years 2004 - 2018, the most belonged to the categories: Fire (34.1%), Overpressure Rupture (32.1%), and Rescue & EMS (11.9%).
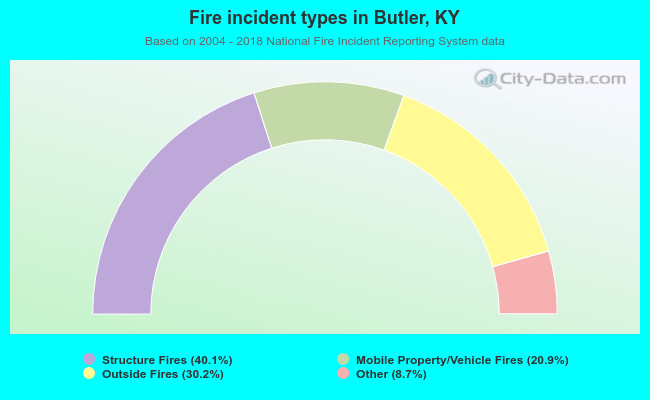 When looking into fire subcategories, the most incidents belonged to: Structure Fires (40.1%), and Outside Fires (30.2%).