Burrton: Fire Incidents, Kansas (KS)
Where are fire incidents reported in Burrton, KS
Something went wrong! Please refresh the page.
|
| |||||||||||||||||||||||||||||||||||||||||||||||||||||||||||||||||||||||||||||||||||||||||||||||||||||||||||||
2002 - 2018 National Fire Incident Reporting System (NFIRS) incidents
- Incident types reported to NFIRS in Burrton, KS
- 48761.9%Fire
- 14618.6%Rescue & EMS
- 658.3%Good Intent Call
- 496.2%Hazardous Condition
- 273.4%Service Call
- 81.0%False Alarm
- 50.6%Severe Weather
- Fire incident types reported to NFIRS in Burrton, KS
- 37176.2%Outside Fires
- 6814.0%Structure Fires
- 449.0%Mobile Property/Vehicle Fires
- 40.8%Other
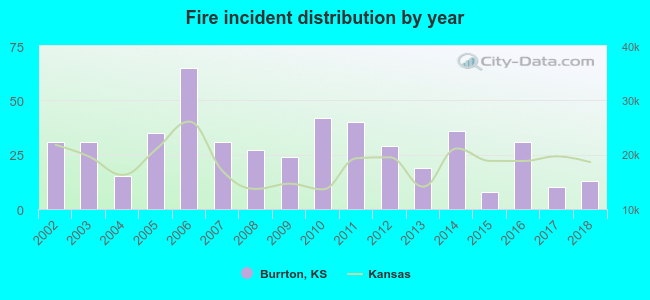 According to the data from the years 2002 - 2018 the average number of fire incidents per year is 29. The highest number of fires - 65 took place in 2006, and the least - 8 in 2015. The data has a dropping trend.
 22.2% incidents where reported in the morning and 77.8% in the evening. The most fires (18.1%) took place on Friday, and the least (12.5%) on Tuesday.
 According to the 487 fires from years 2002 - 2018 most fires (19.3%) took place during March, and the least (2.9%) in December.
 Out of all 787 cases reported during the years 2002 - 2018, the most belonged to the categories: Fire (61.9%), Overpressure Rupture (18.6%), and Service Call (8.3%).
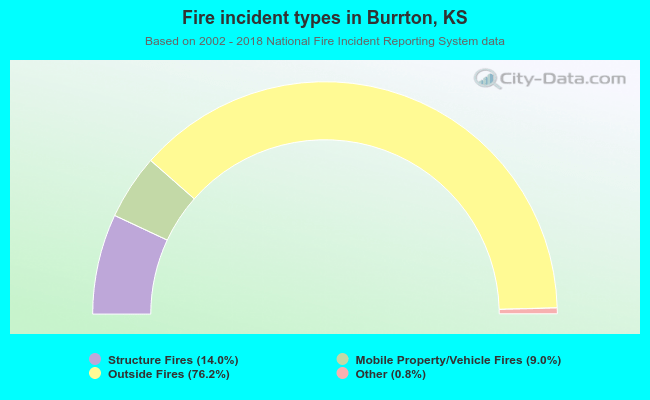 When looking into fire subcategories, the most reports belonged to: Outside Fires (76.2%), and Structure Fires (14.0%).