Burnsville: Fire Incidents, North Carolina (NC)
Where are fire incidents reported in Burnsville, NC
Something went wrong! Please refresh the page.
|
| |||||||||||||||||||||||||||||||||||||||||||||||||||||||||||||||||||||||||||||||||||||||||||||||||||||||||||||
| Other | 636 | |||||||||||||||||||||||||||||||||||||||||||||||||||||||||||||||||||||||||||||||||||||||||||||||||||||||||||||
2002 - 2018 National Fire Incident Reporting System (NFIRS) incidents
- Incident types reported to NFIRS in Burnsville, NC
- 2,33128.0%Rescue & EMS
- 2,08125.0%Hazardous Condition
- 1,34616.2%Fire
- 1,08813.1%Good Intent Call
- 7839.4%Service Call
- 5686.8%False Alarm
- 1121.3%Severe Weather
- 130.2%Special Incident
- Fire incident types reported to NFIRS in Burnsville, NC
- 78057.9%Structure Fires
- 34825.9%Outside Fires
- 1118.2%Mobile Property/Vehicle Fires
- 1077.9%Other
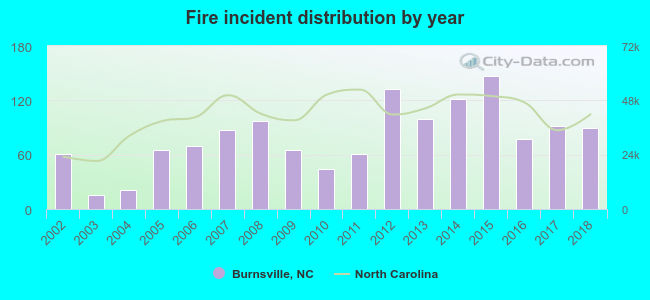 According to the data from the years 2002 - 2018 the average number of fire incidents per year is 79. The highest number of reported fires - 147 took place in 2015, and the least - 16 in 2003. The data has an increasing trend.
 The median response time based on all reported fire incidents is 9 minutes. This is higher than the state median value.
The median response time in Burnsville, NC compared to nearest cities:
(Note: Based on data for all years, including only cities with at least 500 fire incidents)
| Burnsville: | 9 minutes |
| Spruce Pine: | 10 minutes |
| Black Mountain: | 6 minutes |
| Old Fort: | 11 minutes |
| Weaverville: | 7 minutes |
| Swannanoa: | 8 minutes |
| Marshall: | 10 minutes |
| Marion: | 9 minutes |
| Newland: | 8 minutes |
 Based on the reports from the years 2002 - 2018 the average number of fire-related yearly deaths is 0. The highest number of deaths - 2 took place in 2012, and the lowest - 0 in 2002. The data has an increasing trend.
 29.9% incidents where reported in the morning and 70.1% in the evening. The most fires (15.7%) took place on Thursday, and the least (11.3%) on Sunday.
 According to the 1,346 fire incident reports from years 2002 - 2018 most fires (14.7%) took place during March, and the least (3.3%) in August.
 Out of all 8,327 cases reported during the years 2002 - 2018, the most belonged to the categories: Rescue & EMS (28.0%), Hazardous Condition (25.0%), and Fire (16.2%).
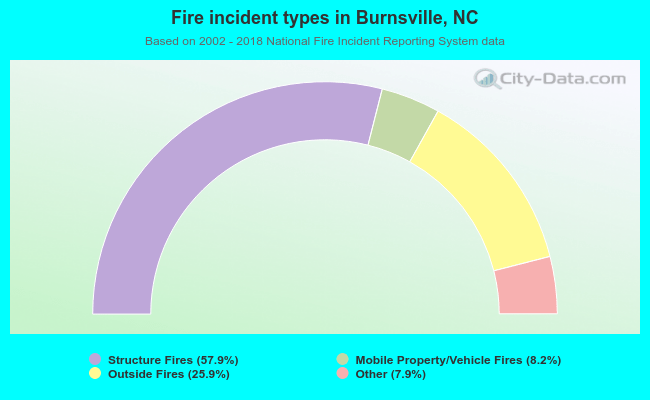 When looking into fire subcategories, the most reports belonged to: Structure Fires (57.9%), and Outside Fires (25.9%).