Burlington: Fire Incidents, North Carolina (NC)
Where are fire incidents reported in Burlington, NC
Something went wrong! Please refresh the page.
| Fire incidents reported | |
|---|---|
| Sreet name | Count |
| CHURCH ST | 532 |
| HUFFMAN MILL RD | 226 |
| MEBANE ST | 226 |
| NC 49 HWY | 144 |
| MAPLE AVE | 140 |
| BURCH BRIDGE RD | 122 |
| NC 62 HWY | 118 |
| WEBB AVE | 106 |
| MAIN ST | 102 |
| UNION RIDGE RD | 102 |
| GARDEN RD | 96 |
| MAPLE | 94 |
| EVERETT ST | 90 |
| MORNINGSIDE DR | 82 |
| SHARPE RD | 82 |
| 62 HWY | 80 |
| DURHAM ST | 80 |
| UNIVERSITY DR | 80 |
| GRAHAM HOPEDALE RD | 72 |
| ANTHONY RD | 68 |
| I 40 | 68 |
| TUCKER ST | 66 |
| ALAMANCE RD | 64 |
| ALTAMAHAW UNION RIDGE RD | 64 |
| DAVIS ST | 64 |
| INTERSTATE I85 NST | 60 |
| SIXTH ST | 58 |
| STONEY CREEK CHURCH RD | 58 |
| BROOKWOOD AVE | 54 |
| FRONT ST | 50 |
| Other | 2,669 |
2002 - 2018 National Fire Incident Reporting System (NFIRS) incidents
- Incident types reported to NFIRS in Burlington, NC
- 40,80365.9%Rescue & EMS
- 5,9179.6%Fire
- 4,6227.5%Good Intent Call
- 3,9806.4%Hazardous Condition
- 3,6695.9%False Alarm
- 2,6814.3%Service Call
- 1100.2%Severe Weather
- 770.1%Overpressure Rupture
- Fire incident types reported to NFIRS in Burlington, NC
- 2,46341.6%Structure Fires
- 2,05934.8%Outside Fires
- 94315.9%Mobile Property/Vehicle Fires
- 4527.6%Other
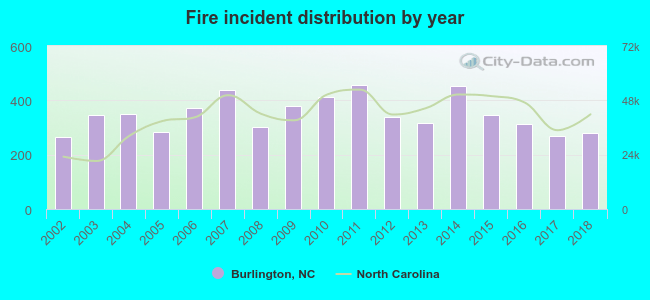 According to the data from the years 2002 - 2018 the average number of fire incidents per year is 348. The highest number of reported fires - 457 took place in 2011, and the least - 264 in 2002. The data has an increasing trend.
The average number of yearly fire incidents per 10k residents in Burlington, NC compared to nearest cities:
(Note: Based on data for the last 3 years, including only cities with population 5,000 and above)
| Burlington: | 55.4 |
| Graham: | 45.8 |
| Elon: | 49.2 |
| Gibsonville: | 135.9 |
| Mebane: | 102.7 |
| Hillsborough: | 146.6 |
| Greensboro: | 33.0 |
| Reidsville: | 108.2 |
| Carrboro: | 29.5 |
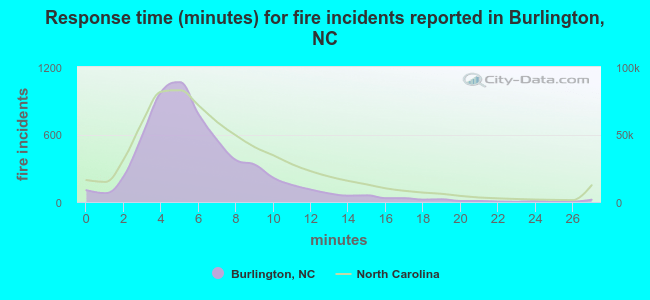 The median response time based on all reported fire incidents is 5 minutes. This is lower than the state median value.
The median response time in Burlington, NC compared to nearest cities:
(Note: Based on data for all years, including only cities with at least 500 fire incidents)
| Burlington: | 5 minutes |
| Graham: | 6 minutes |
| Elon: | 6 minutes |
| Gibsonville: | 5 minutes |
| Whitsett: | 6 minutes |
| Mebane: | 7 minutes |
| McLeansville: | 6 minutes |
| Liberty: | 8 minutes |
| Hillsborough: | 8 minutes |
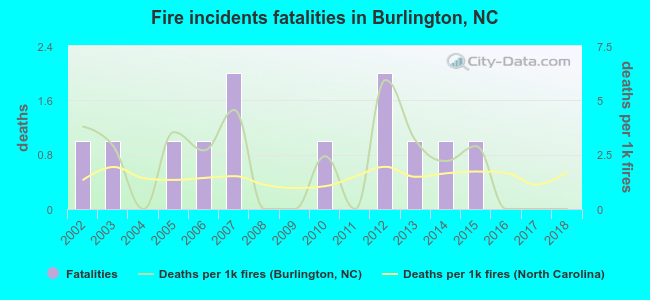 Based on the reports from the years 2002 - 2018 the average number of fire-related yearly deaths is 1. The highest number of deaths - 2 took place in 2007, and the lowest - 0 in 2004. The data has a decreasing trend.
The average number of fatalities per 1,000 fires is 2. This indicator was the highest - 6 in 2012, and the lowest 0 in 2004. The trend for deaths per 1,000 fire incidents is dropping. Compared to the North Carolina value the number of fatalities per 1,000 incidents is higher.
Based on the reports from the years 2002 - 2018 the average number of fire-related yearly deaths is 1. The highest number of deaths - 2 took place in 2007, and the lowest - 0 in 2004. The data has a decreasing trend.
The average number of fatalities per 1,000 fires is 2. This indicator was the highest - 6 in 2012, and the lowest 0 in 2004. The trend for deaths per 1,000 fire incidents is dropping. Compared to the North Carolina value the number of fatalities per 1,000 incidents is higher.Deaths per 1,000 incidents in Burlington, NC compared to nearest cities:
(Note: Based on data for all years, including only cities with at least 2,500 fire incidents)
| Burlington: | 2.0 |
| Greensboro: | 1.9 |
| Reidsville: | 2.9 |
| Chapel Hill: | 0.5 |
| Durham: | 1.4 |
| High Point: | 1.2 |
| Asheboro: | 0.3 |
| Kernersville: | 1.1 |
| Thomasville: | 2.5 |
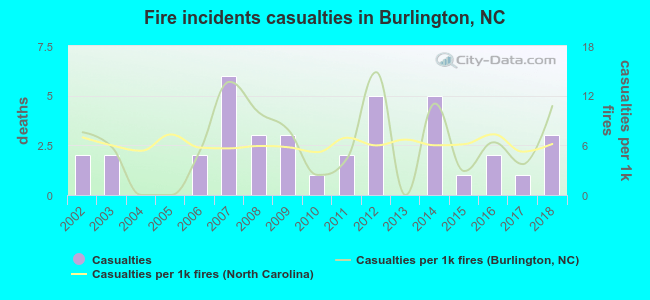 Based on the reports from the years 2002 - 2018 the average number of fire-related casualties per year is 2. The highest number of injuries - 6 took place in 2007, and the lowest - 0 in 2004. The data has a growing trend.
The average number of injuries per 1,000 fires is 6. This indicator was the highest - 15 in 2012, and the lowest 0 in 2004. The trend for casualties per 1,000 fires is growing. Compared to the North Carolina value the number of casualties per 1,000 fires is similar.
Based on the reports from the years 2002 - 2018 the average number of fire-related casualties per year is 2. The highest number of injuries - 6 took place in 2007, and the lowest - 0 in 2004. The data has a growing trend.
The average number of injuries per 1,000 fires is 6. This indicator was the highest - 15 in 2012, and the lowest 0 in 2004. The trend for casualties per 1,000 fires is growing. Compared to the North Carolina value the number of casualties per 1,000 fires is similar.Casualties per 1,000 incidents in Burlington, NC compared to nearest cities:
(Note: Based on data for all years, including only cities with at least 500 fire incidents)
| Burlington: | 6.4 |
| Graham: | 1.5 |
| Elon: | 12.8 |
| Gibsonville: | 2.7 |
| Whitsett: | 2.9 |
| Mebane: | 8.1 |
| McLeansville: | 2.3 |
| Liberty: | 0.0 |
| Hillsborough: | 1.4 |
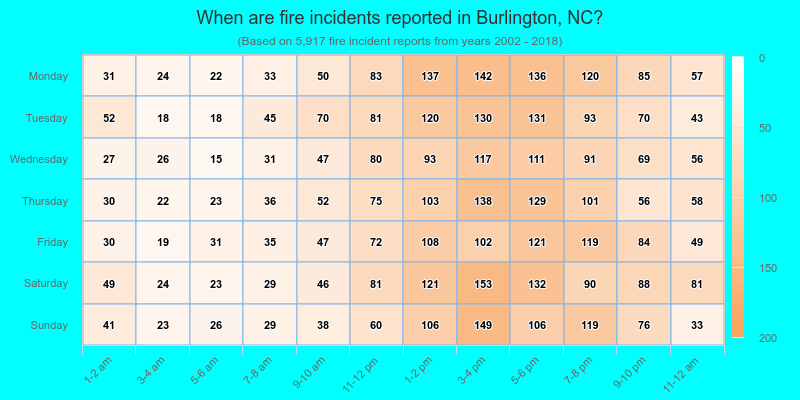
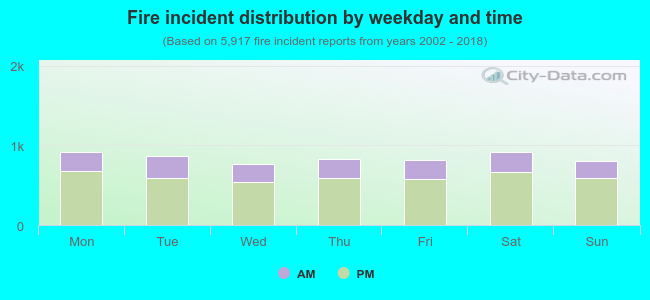 28.6% incidents where reported in the morning and 71.4% in the evening. The most fires (15.5%) took place on Monday, and the least (12.9%) on Wednesday.
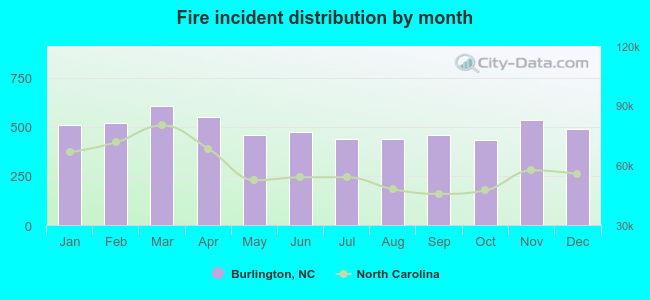 According to the 5,917 reports from years 2002 - 2018 most fires (10.3%) took place during March, and the least (7.4%) in October.
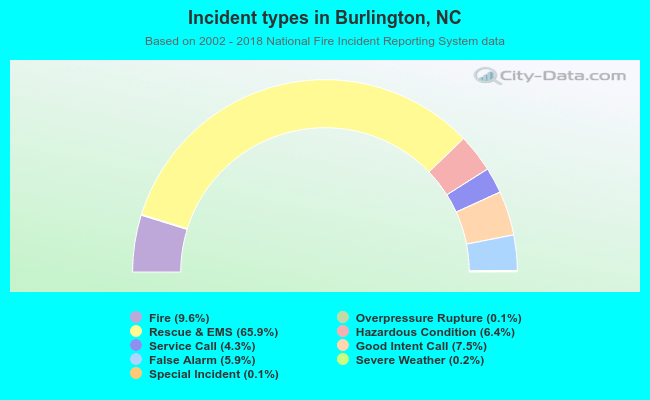 Out of all 61,896 cases reported during the years 2002 - 2018, the most belonged to the categories: Rescue & EMS (65.9%), Fire (9.6%), and Good Intent Call (7.5%).
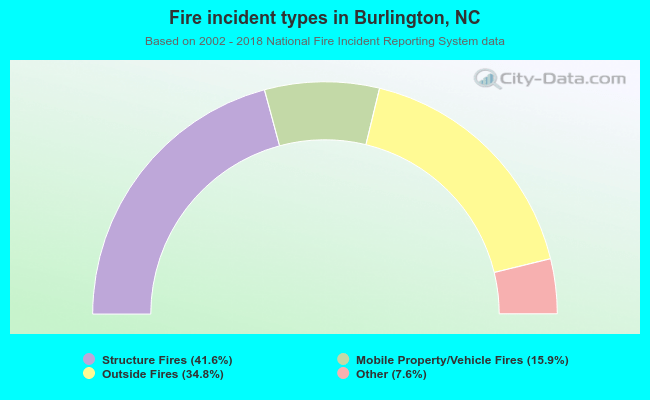 When looking into fire subcategories, the most reports belonged to: Structure Fires (41.6%), and Outside Fires (34.8%).