Bunker Hill: Fire Incidents, Indiana (IN)
Where are fire incidents reported in Bunker Hill, IN
Something went wrong! Please refresh the page.
|
| |||||||||||||||||||||||||||||||||||||||||||||||||||||||||||||||||||||||||||||||||||||||||||||||||||||||||||||
2002 - 2018 National Fire Incident Reporting System (NFIRS) incidents
- Incident types reported to NFIRS in Bunker Hill, IN
- 48933.8%Rescue & EMS
- 36325.1%Hazardous Condition
- 36125.0%Fire
- 16111.1%Good Intent Call
- 422.9%False Alarm
- 251.7%Service Call
- 20.1%Overpressure Rupture
- 20.1%Special Incident
- Fire incident types reported to NFIRS in Bunker Hill, IN
- 16746.3%Outside Fires
- 11431.6%Structure Fires
- 4211.6%Other
- 3810.5%Mobile Property/Vehicle Fires
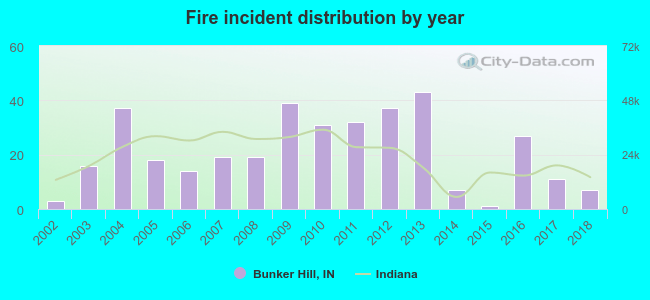 Based on the data from the years 2002 - 2018 the average number of fires per year is 21. The highest number of fire incidents - 43 took place in 2013, and the least - 1 in 2015. The data has a rising trend.
 28.5% incidents where reported in the morning and 71.5% in the evening. The most fires (16.3%) took place on Wednesday, and the least (12.2%) on Monday.
 Based on the 361 reports from years 2002 - 2018 most fires (11.4%) took place during November, and the least (5.5%) in August.
 Out of all 1,445 cases reported during the years 2002 - 2018, the most belonged to the categories: Rescue & EMS (33.8%), Hazardous Condition (25.1%), and Fire (25.0%).
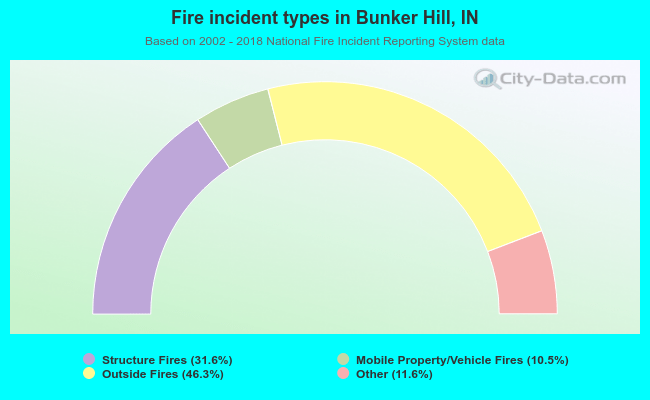 When looking into fire subcategories, the most reports belonged to: Outside Fires (46.3%), and Structure Fires (31.6%).