| Fire incidents reported |
|---|
| Sreet name | Count |
|---|
| INTERSTATE 81 | 100 | | ANDREW JOHNSON HWY | 22 | | GAP CREEK ROAD | 22 | | OASIS ROAD | 16 | | GAP CREEK RD | 14 | | HIGHWAY 113 | 12 | | BULLS GAP ST CLAIR RD | 10 | | HWY 11E | 10 | | MAIN ST | 10 | | MARVIN ROAD | 10 | | TOM WHITE HOLLOW RD | 10 | | HIGHWAY 11E | 8 | | MOHAWK RIDGE RD | 8 | | WHEELER RD | 8 | | GAP CREEK RD | 6 | | HWY 113 | 6 | | HWY. 66 | 6 | | LAUTNER RD | 6 | | MELINDA FERRY RD | 6 | | MOHAWK RIDGE ROAD | 6 | | MT ZION RD | 6 | | PHILLIPS TOWN RD | 6 | | WHITAKER RD | 6 | | WHITE HORN RD | 6 | | 109 PLEASANT HILL ROAD | 4 |
| | | Fire incidents reported |
|---|
| Sreet name | Count |
|---|
| 833 NORTH MAIN STREET | 4 | | 869 BULLS GAP ST. CLAIR RD. RD | 4 | | 913 NORTH MAIN STREET | 4 | | 948 HIGHWAY 11-E | 4 | | ANDREW JOHNSON LGTS | 4 | | BARNETT HOLLOW RD | 4 | | BEACH GROVE RD | 4 | | BERRY RD | 4 | | BERRY ROAD | 4 | | BRANDON HALLOW LANE | 4 | | EAST WELLS HILLS LANE | 4 | | GAP CREEK | 4 | | GAP CREEK ROAD | 4 | | HAMMITT RD | 4 | | HAMMITT ROAD | 4 | | HERBERT LN | 4 | | HIGHWAY 66 SOUTH | 4 | | HIGHWAY 66S | 4 | | HWY 66 S | 4 | | IDELL RD | 4 | | IDELL ROAD | 4 | | LEE VALLEY RD | 4 | | LONESOME PINE TRAIL | 4 | | MOHAWK CREEK ROAD | 4 | | |
|
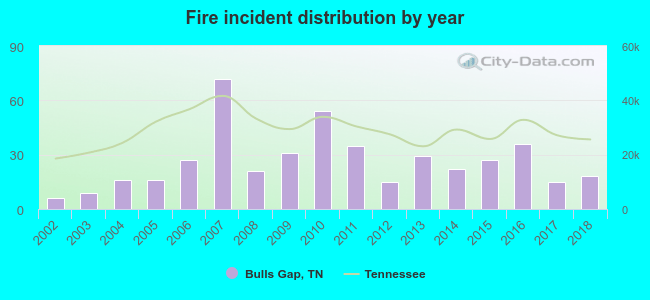 According to the data from the years 2002 - 2018 the average number of fire incidents per year is 26. The highest number of reported fires - 72 took place in 2007, and the least - 6 in 2002. The data has a rising trend.
 32.7% incidents where reported in the morning and 67.3% in the evening. The most fires (16.3%) took place on Tuesday, and the least (11.1%) on Monday.
 According to the 449 fire incident reports from years 2002 - 2018 most fires (12.5%) took place during March, and the least (5.3%) in December.
 Out of all 760 cases reported during the years 2002 - 2018, the most belonged to the categories: Fire (59.1%), Overpressure Rupture (16.2%), and Rescue & EMS (11.6%).
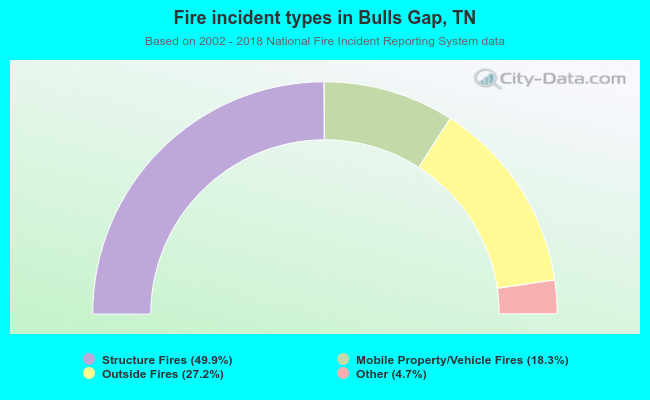 When looking into fire subcategories, the most reports belonged to: Structure Fires (49.9%), and Outside Fires (27.2%).