| Fire incidents reported |
|---|
| Sreet name | Count |
|---|
| 221 NE 1ST | 4 | | HWY 64 | 4 | | 3 N OF BUFFALO | 2 | | 1 1/2 MILES N. ON HWY. 183 | 2 | | 1.5 M. S. OF BUFFALO ON 183 | 2 | | 10 SOUTH3 WEST OF BUFFALO | 2 | | 111 WALNUT DR. | 2 | | 115 NW 3RD | 2 | | 124 NW 2ND | 2 | | 183 HWY | 2 | | 183-160 | 2 | | 1ST & TURNER | 2 | | 203 NE SECOND | 2 | | 204 NE 2ND | 2 | | 205 EAST DICK ST. | 2 | | 212 NW 2ND ST | 2 | | 222 N.E. FIRST | 2 | | 3 1/2 MILES W HW 64 | 2 | | 3.5 W. OF BUFFALO HWY 64 | 2 | | 315 SW THIRD | 2 | | 4 BLK E ON BRULE STREET | 2 | | 402 SOUTH HOY | 2 | | 405 EAST ADAMS | 2 | | 407 LUCIA DR. | 2 | | 422 N E 3RD | 2 |
| | | Fire incidents reported |
|---|
| Sreet name | Count |
|---|
| 5 E ON HWY 64 AND SOUTH INTO | 2 | | 500 BLOCK NORTH EAST | 2 | | 604 SE 5TH | 2 | | 615 N E MAPLE DR | 2 | | 622 S.E. SECOND STREET | 2 | | 64 HWY | 2 | | 7 E 25 N OF BUFFALO | 2 | | 8 WEST OF BUFFALO 64 | 2 | | BUFFALO CITY PARK | 2 | | BURLE AND 4TH ST | 2 | | CR 10 EW & CR 185 | 2 | | E/W 24 & N/S 195 | 2 | | E/W 28 & N/S 209 | 2 | | E/W 5 AND N/S 197 | 2 | | E/W 9 & N/S 198 | 2 | | EAST OF KIBBY CORNER | 2 | | EW 10 NS 197 | 2 | | EW 17 NS 192 | 2 | | EW4&NS183 | 2 | | HARPER COUNTY | 2 | | HIGHWAY | 2 | | HIGHWAY 183 | 2 | | HOY & BRULE | 2 | | HWY 183 | 2 | | |
|
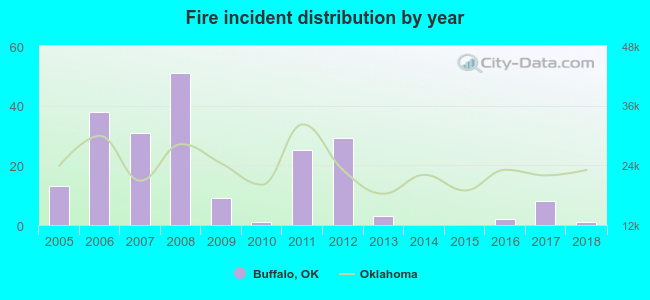 Based on the data from the years 2005 - 2018 the average number of fire incidents per year is 15. The highest number of fire incidents - 51 took place in 2008, and the least - 0 in 2014. The data has a decreasing trend.
 24.6% incidents where reported in the morning and 75.4% in the evening. The most fires (19.0%) took place on Thursday, and the least (10.4%) on Friday.
 According to the 211 fire incidents from years 2005 - 2018 most fires (14.7%) took place during March, and the least (5.2%) in May.
 Out of all 228 cases reported during the years 2005 - 2018, the most belonged to the categories: Fire (92.5%), Overpressure Rupture (4.8%), and Hazardous Condition (2.2%).
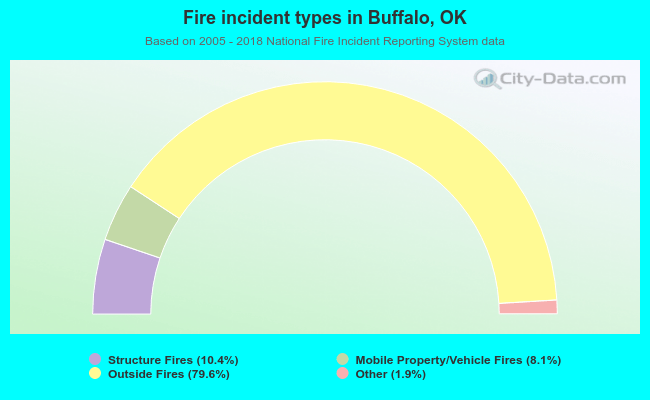 When looking into fire subcategories, the most incidents belonged to: Outside Fires (79.6%), and Structure Fires (10.4%).