Buffalo: Fire Incidents, Illinois (IL)
Where are fire incidents reported in Buffalo, IL
Something went wrong! Please refresh the page.
|
| |||||||||||||||||||||||||||||||||||||||||||||||||||||||||||||||||||||||||||||||||||||||||||||||||||||||||||||
2002 - 2018 National Fire Incident Reporting System (NFIRS) incidents
- Incident types reported to NFIRS in Buffalo, IL
- 43846.3%Rescue & EMS
- 27529.1%Fire
- 10210.8%Good Intent Call
- 525.5%Hazardous Condition
- 424.4%Service Call
- 293.1%False Alarm
- 50.5%Severe Weather
- 30.3%Special Incident
- Fire incident types reported to NFIRS in Buffalo, IL
- 15656.7%Outside Fires
- 5620.4%Structure Fires
- 5118.5%Mobile Property/Vehicle Fires
- 124.4%Other
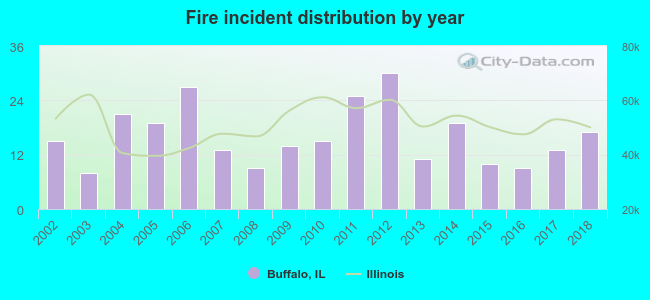 According to the data from the years 2002 - 2018 the average number of fire incidents per year is 16. The highest number of reported fire incidents - 30 took place in 2012, and the least - 8 in 2003. The data has a growing trend.
 24.0% incidents where reported in the morning and 76.0% in the evening. The most fires (18.2%) took place on Thursday, and the least (10.9%) on Tuesday.
 According to the 275 fire incident reports from years 2002 - 2018 most fires (14.9%) took place during March, and the least (2.9%) in December.
 Out of all 946 cases reported during the years 2002 - 2018, the most belonged to the categories: Overpressure Rupture (46.3%), Fire (29.1%), and Service Call (10.8%).
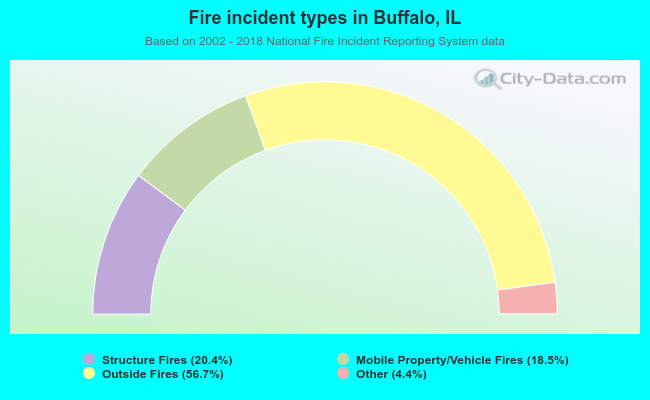 When looking into fire subcategories, the most reports belonged to: Outside Fires (56.7%), and Structure Fires (20.4%).